本文参考《R语言与Bioconductor 生物信息学应用》第五章
1. 快速入门
- 安装并加载所需R包
source("http://bioconductor.org/biocLite.R");
biocLite(“CLL”)
# 载入CLL包,CLL包会自动调用affy包,该包含有一系列处理函数
library(CLL)
# read example dataset,(CLL包附带的示例数据集)
data("CLLbatch")
# pre-process using RMA method
CLLrma <- rma(CLLbatch)
# read expression value after pre-processing
e <- exprs(CLLrma)
# 查看部分数据
e[1:5, 1:5]
2. 基因芯片数据预处理
2.1 数据输入
# 载入CLL包,CLL包会自动调用affy包,该包含有一系列处理函数
library(CLL)
# read example dataset,(CLL包附带的示例数据集)
data("CLLbatch")
# 查看数据类型
data.class(CLLbatch)
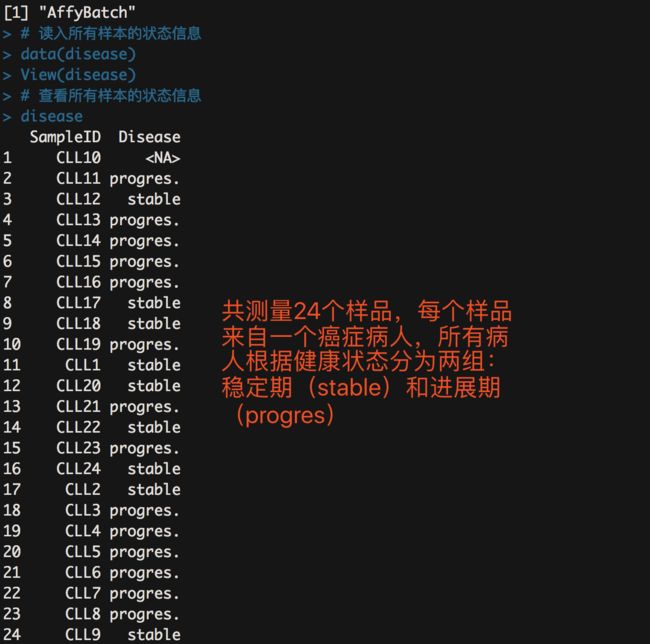
# 读入所有样本的状态信息
data(disease)
# 查看所有样本的状态信息
disease
# 查看"AffyBatch"的详细介绍
help(AffyBatch)
phenoData(CLLbatch)
featureData(CLLbatch)
protocolData(CLLbatch)
annotation(CLLbatch)
exprs_matrix <- assayData(CLLbatch)[[1]]
exprs_matrix[1:5, 1:5]
exprs(CLLbatch)[1:5, 1:5]
2.2 质量控制
质量控制分三步,直观观察,平均值方法,数据拟合方法。这三个层次的质量控制分别由image 函数、simpleaffy 包和affyPLM包实现
2.2.1 用image包对芯片数据进行质量评估
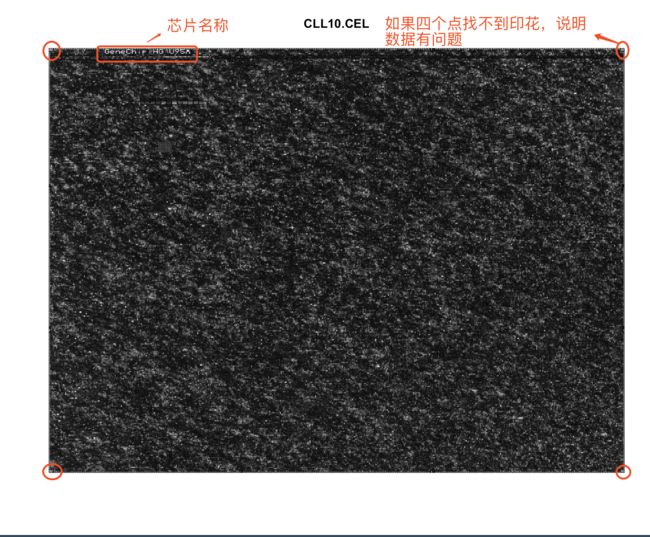
# 查看第一张芯片的灰度图像
image(CLLbatch[,1])
-
如果图像特别黑,说明型号强度低;如果图像特别亮,说明信号强度很有可能过饱和
2.2.2 用simpleaffy包对芯片数据进行质量评估
# 安装simpleaffy包
source('http://Bioconductor.org/biocLite.R')
biocLite("simpleaffy")
library(BiocInstaller)
biocLite("simpleaffy")
library(simpleaffy)
library(CLL)
data(CLLbatch)
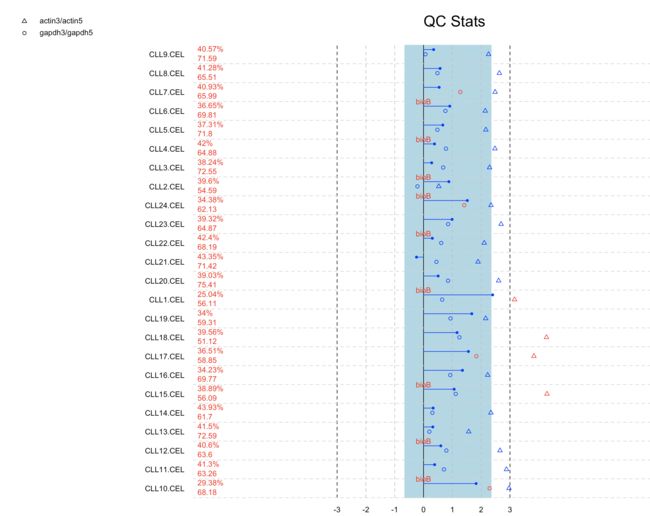
# 获取质量分析报告
Data.qc <- qc(CLLbatch)
# 图型化显示报告
plot(Data.qc)
- 第一列是所有样品的名称
- 第二列检出率和平均背景噪声(往往较高的平均背景噪声都伴随着较低的检出率)
- 第三列
- 蓝色实现为尺度因子,取值(-3,3)
- "o" 不能超过1.25,否则数据质量不好
- “三角型“不能超过3,否则数据质量不好
- bioB 说明芯片检测没有达标
2.2.3 用affyPLM包对芯片数据进行质量评估
source('http://Bioconductor.org/biocLite.R')
biocLite('affyPLM')
library(affyPLM)
data(CLLbatch)
# 对数据集做回归分析,结果为一个PLMset类型的对象
Pset <- fitPLM(CLLbatch)
image(CLLbatch[,1])
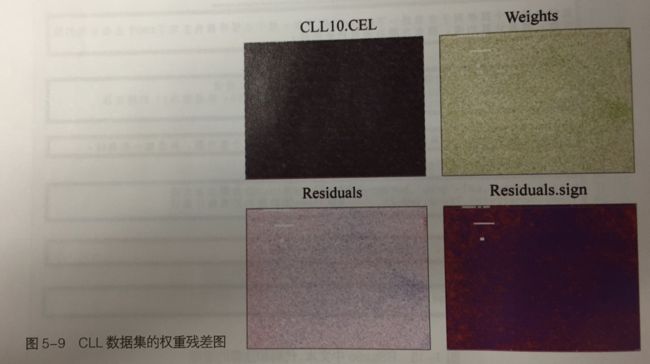
# 根据计算结果,画权重图
image(Pset, type="weights", which=1, main="Weights")
# 根据计算结果,画残差图
image(Pset,  type="resids", which=1, main="Residuals")
# 根据计算结果,画残差符号图
image(Pset, type="sign.resids", which=1, main="Residuals.sign")
image.png
2.2.4 查看总体质量
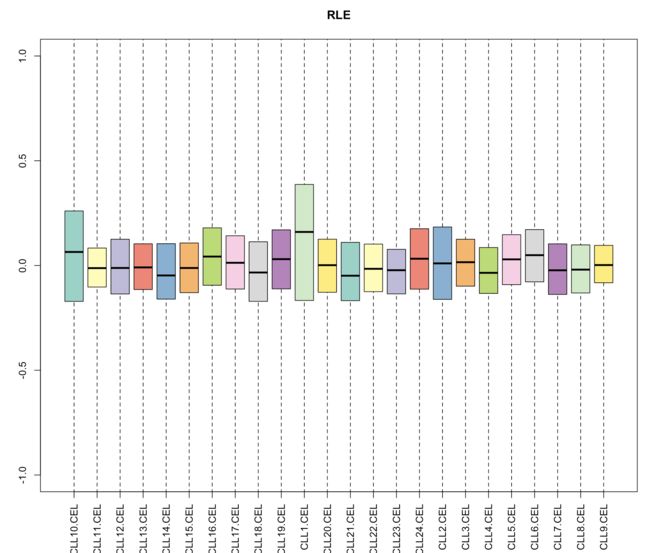
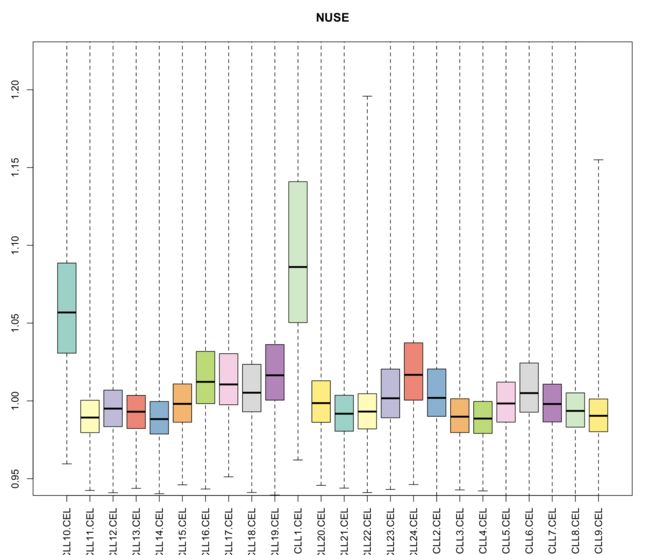
- 一个样品的所有探针组的RLE分布可以用一个统计学中常用的箱型图形表示
source('http://Bioconductor.org/biocLite.R')
biocLite("RColorBrewer")
library(affyPLM)
library(RColorBrewer)
library(CLL)
# 读入数据
data("CLLbatch")
# 对数据集做回归计算
Psel<-fitPLM(CLLbatch)
# 载入一组颜色
colors<-brewer.pal(12,"Set3")
# 绘制RLE箱线图
Mbox(Pset, ylim=c(-1,1),col=colors,main="RLE",las=3);
# 绘制NUSE箱线图
boxplot(Pset,ylim=c(0.95,1.22),col=colors,main="NUSE",las=3)
-
从以下两幅图中可以看出CLL1,CLL10 的质量明显有别与其他样品,需要去除
2.2.5 查看RNA降解曲线
source('http://Bioconductor.org/biocLite.R')
biocLite("affy")
library(affy)
library(RColorBrewer)
library(CLL)
data("CLLbatch")
# 获取降解数据
data.deg <- AffyRNAdeg(CLLbatch)
# 载入一组颜色
colors <- brewer.pal(12, "Set3")
# 绘制RNA降解图
plotAffyRNAdeg(data.deg, col=colors)
# 在左上部位加注图注
legend("topleft", rownames(pData(CLLbatch)), col=colors, lwd=1, inset=0.05, cex=0.5)
- 去掉三个质量差的
CLLbatch <- CLLbatch[, -match(c("CLL10.CEL", "CLL1.CEL", "CLL13.CEL"),
                              sampleNames(CLLbatch))]
2.2.6 从聚类分析的角度看数据质量
source('http://Bioconductor.org/biocLite.R')
biocLite("gcrma")
biocLite("graph")
biocLite("affycoretools")

library(CLL)
library(gcrma)
library(graph)
library(affycoretools)
data(CLLbatch)
data("disease")
# 使用gcrma算法来预处理数据
CLLgcrma<-gcrma(CLLbatch)
# 提取基因表达矩阵
eset<-exprs(CLLgcrma)
# 计算样品两两之间的Pearson相关系数
pearson_cor<-cor(eset)
# 得到Pearson距离的下三角矩阵
dist.lower<-as.dist(1-pearson_cor)
# 聚类分析
hc<-hclust(dist.lower,"ave")
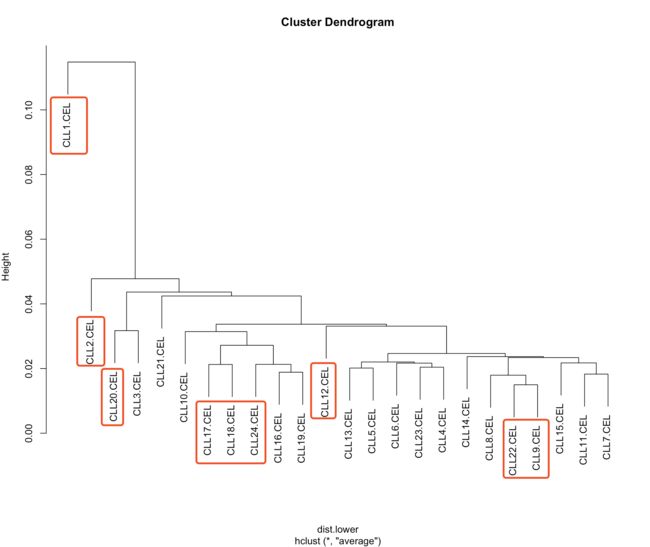
plot(hc)
# PCA分析
samplenames<-sub(pattern="\\.CEL", replacement = "",colnames(eset))
groups<-factor(disease[,2])
plotPCA(eset,addtext=samplenames,groups=groups,groupnames=levels(groups))
-
从聚类分析的结果来看,稳定组(红框)和恶化组分不开
-
从主成成份分析来看,也分不开
2.3 背景校正、标准化和汇总
- 芯片数据通过质量控制,剔除不合格的样品,留下的样品数据往往要通过三步处理(背景校正、标准化和汇总)才能得到下一步分析所需要的基因表达矩阵
- 去除背景噪声的过程叫背景校正
- 标准化目的是使各次/组测量或各种实验条件下的测量可以相互比较
- 使用一定的统计方法将前面得到的荧光强度值从探针水平汇总到探针组水平
> bgcorrect.methods()
[1] "bg.correct" "mas"        "none"       "rma"
> normalize.methods(CLLbatch)
 [1] "constant"           "contrasts"          "invariantset"       "loess"              "methods"            "qspline"
 [7] "quantiles"          "quantiles.robust"   "quantiles.probeset" "scaling"
> pmcorrect.methods()
[1] "mas"        "methods"    "pmonly"     "subtractmm"
> express.summary.stat.methods()
[1] "avgdiff"      "liwong"       "mas"          "medianpolish" "playerout"
| 参数 | 说明 |
|---|---|
| afbatch | 输入数据的类型必须是AffyBatch对象 |
| bgcorrect.method | 背景校正方法 |
| bgcorrect.param | 指定背景校正方法的参数 |
| normalize.method | 标准化方法 |
| normalize.param | 指定标准化方法的参数 |
| pmcorrect.method | PM调整方法 |
| pmcorrect.param | 指定PM方法参数 |
| summary.method | 汇总方法 |
| summary.param | 指定汇总方法的参数 |
- 芯片内标准化(Loess)前后MA图
# 使用mas方法做背景校正
> CLLmas5 <- bg.correct(CLLbatch, method = "mas")
# 使用constant方法标准化
> data_mas5 <- normalize(CLLmas5, method="constant")
# 查看每个样品的缩放系数
> head(pm(data_mas5)/pm(CLLmas5), 5)
       CLL11.CEL CLL12.CEL CLL14.CEL CLL15.CEL CLL16.CEL CLL17.CEL CLL18.CEL CLL19.CEL CLL20.CEL CLL21.CEL CLL22.CEL CLL23.CEL
175218         1  1.155849  1.023873  1.493193  1.549369  2.000299  1.451576  1.776501 0.9825108 0.7070828 0.9958733  1.432365
356689         1  1.155849  1.023873  1.493193  1.549369  2.000299  1.451576  1.776501 0.9825108 0.7070828 0.9958733  1.432365
227696         1  1.155849  1.023873  1.493193  1.549369  2.000299  1.451576  1.776501 0.9825108 0.7070828 0.9958733  1.432365
237919         1  1.155849  1.023873  1.493193  1.549369  2.000299  1.451576  1.776501 0.9825108 0.7070828 0.9958733  1.432365
275173         1  1.155849  1.023873  1.493193  1.549369  2.000299  1.451576  1.776501 0.9825108 0.7070828 0.9958733  1.432365
       CLL24.CEL CLL2.CEL  CLL3.CEL  CLL4.CEL  CLL5.CEL CLL6.CEL CLL7.CEL CLL8.CEL  CLL9.CEL
175218  1.706026 1.156378 0.8425419 0.9775082 0.9816573 1.182963 1.114976  1.13639 0.8939248
356689  1.706026 1.156378 0.8425419 0.9775082 0.9816573 1.182963 1.114976  1.13639 0.8939248
227696  1.706026 1.156378 0.8425419 0.9775082 0.9816573 1.182963 1.114976  1.13639 0.8939248
237919  1.706026 1.156378 0.8425419 0.9775082 0.9816573 1.182963 1.114976  1.13639 0.8939248
275173  1.706026 1.156378 0.8425419 0.9775082 0.9816573 1.182963 1.114976  1.13639 0.8939248
# 查看第二个样品的缩放系数是怎么计算来的
> mean(intensity(CLLmas5)[,1])/mean(intensity(CLLmas5)[,2])
[1] 1.155849
2.4 预处理的一体化算法
- 预处理方法
| 方法 | 背景校正方法 | 标准化方法 | 汇总方法 |
|---|---|---|---|
| MASS | mas | constant | mas |
| dChip | mas | invariantset | liwong |
| RMA | rma | quantile | medianpolish |
MAS5 每个芯片可以单独进行标准化;RMA 采用多芯片模型,需要对所有芯片一起进行标准化。
MAS5 利用MM探针的信息去除背景噪声,基本思路是MP-MM;RMA 不使用MM信息,而是基于PM信号分布采用的随机模型来估计表达值。
RMA处理后的数据是经过2为底的对数转换的,而MAS5不是,这一点非常重要,因为大多数芯片分析软件和函数的输入数据必须经过对数变换。
比较不同算法的处理效果
library(affy)
library(gcrma)
library(affyPLM)
library(RColorBrewer)
library(CLL)

data("CLLbatch")
colors <- brewer.pal(12, "Set3")
# use MAS5
CLLmas5 <- mas5(CLLbatch)
# use rma
CLLrma <- rma(CLLbatch)
# use gcrma
CLLgcrma <- gcrma(CLLbatch)

## hist plot
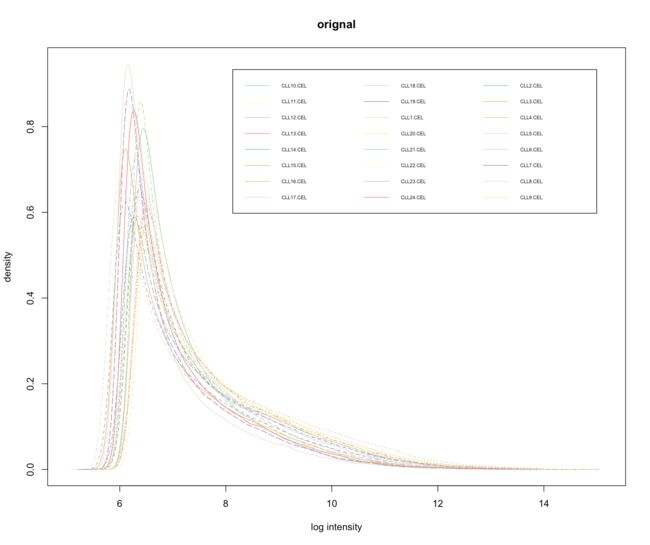
hist(CLLbatch, main="orignal", col=colors)
legend("topright", rownames(pData(CLLbatch)), col=colors,
       lwd=1, inset=0.05, cex=0.5, ncol=3)
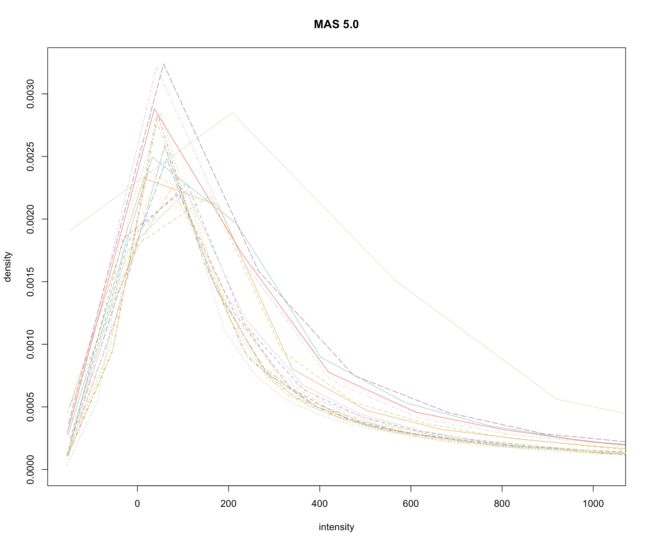
hist(CLLmas5, main="MAS 5.0", xlim=c(-150,2^10), col=colors)
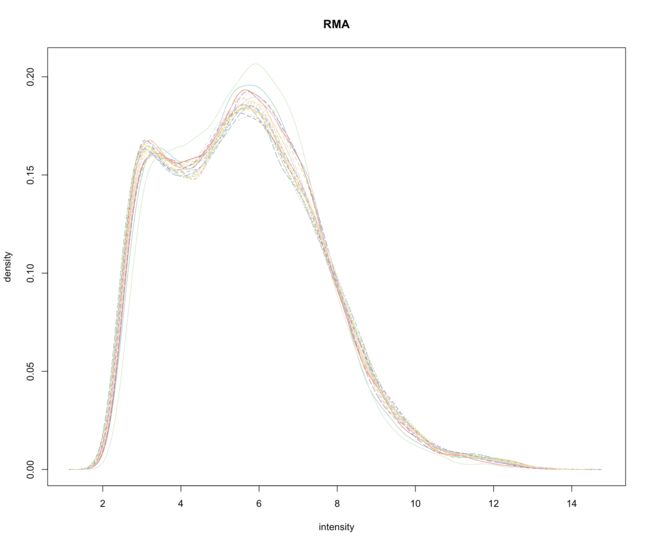
hist(CLLrma, main="RMA", col=colors)
hist(CLLgcrma, main="gcRMA", col=colors)
## boxplot
boxplot(CLLbatch, col=colors, las=3, main="original")
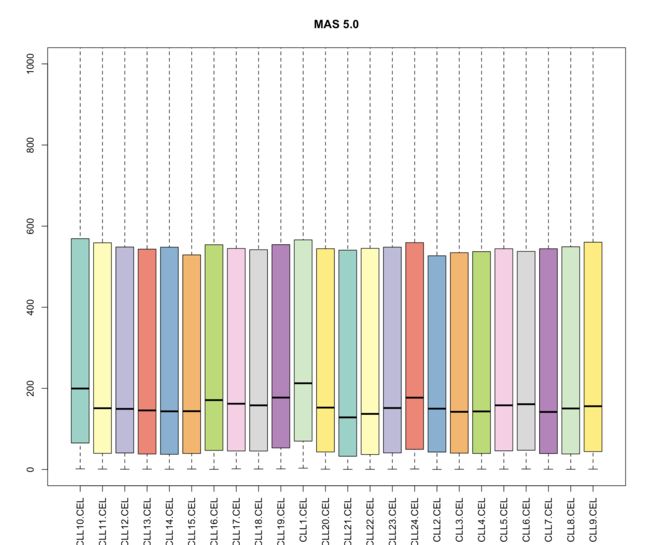
boxplot(CLLmas5, col=colors, las=3, ylim=c(0,1000), main="MAS 5.0")
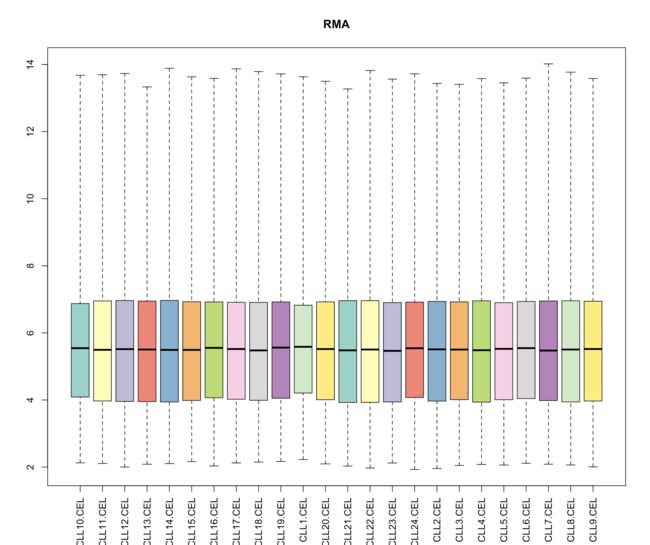
boxplot(CLLrma, col=colors, las=3, main="RMA")
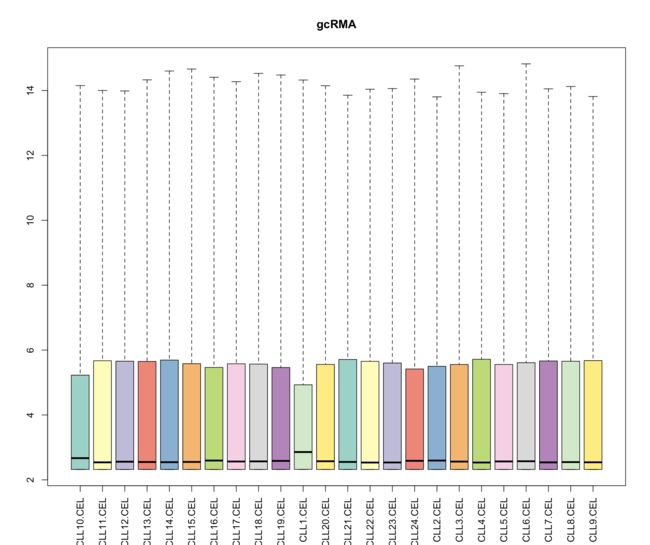
boxplot(CLLgcrma, col=colors, las=3, main="gcRMA")
-
RMA算法将多条曲线重合到了一起,有利于进一步的差异分析,但却出现了双峰现象,不符合高斯正态分布。很显然gcRMA算法在这里表现的更好。
-
三个算法处理后的各样品的中值都十分接近。MAS5算法总体而言还不错,有一定拖尾现象;而gcRMA的拖尾现象比RMA要明显得多。这说明针对低表达量的基因,RMA算法比gcRMA算法表现更好一些。
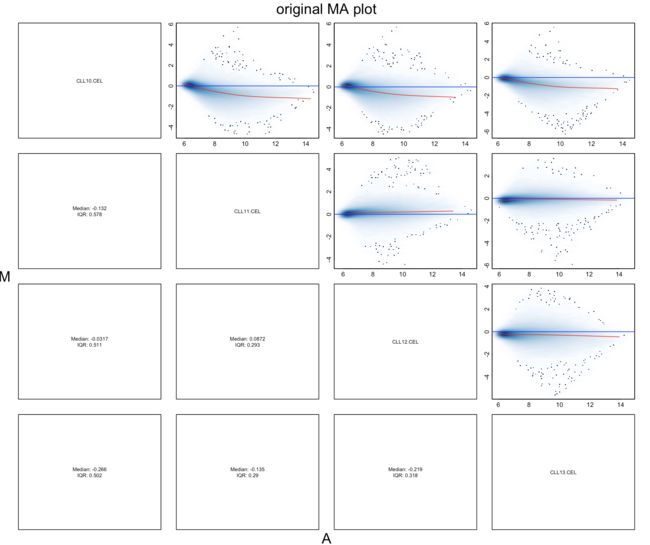
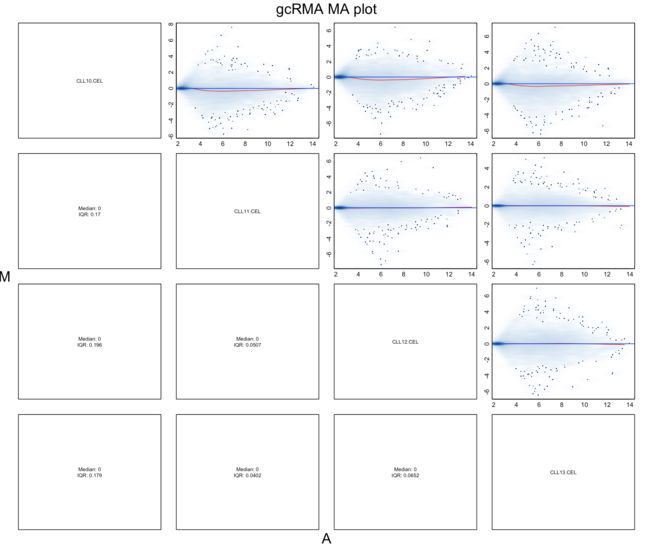
- 通过MA图来查看标准化处理的效
library(gcrma)
library(RColorBrewer)
library(CLL)
library(affy)
data("CLLbatch")
colors<-brewer.pal(12."Set3")
CLLgcrma<-gcrma(CLLbatch)
MAplot(CLLbatch[,1:4],pairs=TRUE,plot.method="smoothScatter",cex=0.8,main="original MA plot")
MAplot(CLLgcrma[,1:4],pairs=TRUE,plot.method="smoothScatter",cex=0.8,main="gcRMA MA plot")
- 原始数据中,中值(红线)偏离0,经过gcRMA处理后,中值基本保持在零线上。
3 基因芯片数据分析
3.1 选取差异表达基因
####
#### DEG analysis

# 如果没有安装limma包,请取消下面两行注释
# library(BiocInstaller)
# biocLite("limma")

# 导入包
library(limma)
library(gcrma)
library(CLL)

# 导入CLL数据
data("CLLbatch")
data(disease)

# 移除 CLL1, CLL10, CLL13
CLLbatch <- CLLbatch[, -match(c("CLL10.CEL", "CLL1.CEL", "CLL13.CEL"),
                              sampleNames(CLLbatch))]
# 用gcRMA算法进行预处理
CLLgcrma <- gcrma(CLLbatch)

# remove .CEL in sample names
sampleNames(CLLgcrma) <- gsub(".CEL$", "", sampleNames(CLLgcrma))
# remove record in data disease about CLL1, 10 and 13.CEL
disease <- disease[match(sampleNames(CLLgcrma), disease[, "SampleID"]), ]

# 获得余下21个样品的基因表达矩阵
eset <- exprs(CLLgcrma)

# 提取实验条件信息
disease <- factor(disease[, "Disease"])

# 构建实验设计矩阵
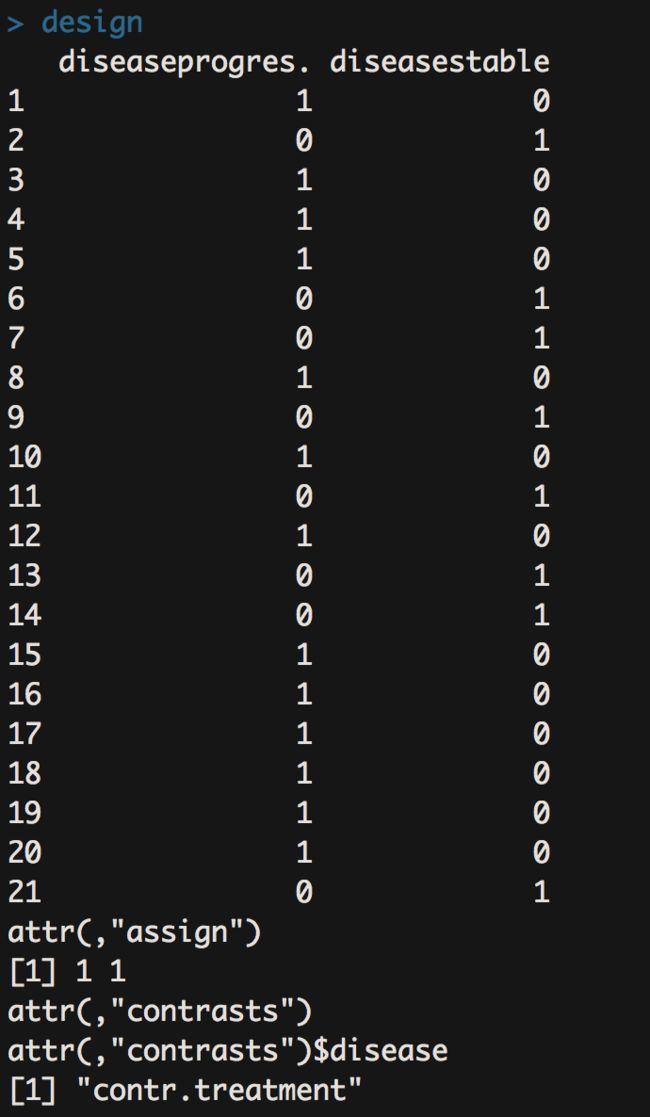
design <- model.matrix(~-1+disease)
# 构建对比模型,比较两个实验条件下表达数据
# 这里的.是简写而不是运算符号
contrast.matrix <- makeContrasts(contrasts = "diseaseprogres. - diseasestable",
                                 levels=design)

# 线性模型拟合
fit <- lmFit(eset, design)
# 根据对比模型进行差值计算
fit1 <- contrasts.fit(fit, contrast.matrix)
# 贝叶斯检验
fit2 <- eBayes(fit1)

# 生成所有基因的检验结果报告
dif <- topTable(fit2, coef="diseaseprogres. - diseasestable", n=nrow(fit2), lfc=log2(1.5))
# 用P.Value进行筛选,得到全部差异表达基因
dif <- dif[dif[, "P.Value"]<0.01,]
# 显示一部分报告结果
head(dif)
> head(dif)
              logFC  AveExpr         t      P.Value adj.P.Val         B
39400_at -0.9997850 5.634004 -5.727329 1.482860e-05 0.1034544 2.4458354
1303_at  -1.3430306 4.540225 -5.596813 1.974284e-05 0.1034544 2.1546350
33791_at  1.9647962 6.837903  5.400499 3.047498e-05 0.1034544 1.7135583
36131_at  0.9574214 9.945334  5.367741 3.277762e-05 0.1034544 1.6396223
37636_at  2.0534093 5.478683  5.120519 5.699454e-05 0.1439112 1.0788313
36122_at  0.8008604 7.146293  4.776721 1.241402e-04 0.2612118 0.2922106
- 下面逐次介绍这个分析过程的六个关键步骤:构建基因表达矩阵、构建实验设计矩阵、构建对比模型(对比矩阵)、线性模型拟合、贝叶斯检验和生成结果报表。
design
3.2 注释
# 加载注释工具包
library(annotate)

# 获得基因芯片注释包名称
affydb <- annPkgName(CLLbatch@annotation, type="db")
affydb
# 如果没有安装,先安装
biocLite(affydb)
# 加载该包
library(affydb, character.only = TRUE)
# 根据每个探针组的ID获取对应基因Gene Symbol,并作为新的一列
dif$symbols <- getSYMBOL(rownames(dif), affydb)
# 根据探针ID获取对应基因Entrez ID
dif$EntrezID <- getEG(rownames(dif), affydb)
# 显示前几行
head(dif)
3.3 统计分析及可视化
# 加载包
library(GOstats)
# 提取HG_U95Av2芯片中所有探针组对应的EntrezID,注意保证uniq
entrezUniverse <- unique(unlist(mget(rownames(eset), hgu95av2ENTREZID)))
# 提取差异表达基因及其对应的EntrezID
entrezSelected <- unique(dif[!is.na(dif$EntrezID), "EntrezID"])

# 设置GO富集分析的所有参数
params <- new("GOHyperGParams", geneIds=entrezSelected, universeGeneIds=entrezUniverse,
              annotation=affydb, ontology="BP", pvalueCutoff=0.001, conditional=FALSE,
              testDirection="over")
# 对所有的GOterm根据params参数做超几何检验
hgOver <- hyperGTest(params)

# 生成所有GOterm的检验结果报表
bp <- summary(hgOver)

# 同时生成所有GOterm的检验结果文件,每个GOterm都有指向官方网站的链接,以获得详细信息
htmlReport(hgOver, file="ALL_go.html")

# 显示结果前几行
head(bp)
# 安装并加载所需包
biocLite("GeneAnswers")
library(GeneAnswers)

# 选取dif中的三列信息构成新的矩阵,新一列必须是EntrezID
humanGeneInput <- dif[, c("EntrezID", "logFC", "P.Value")]
# 获得humanGeneInput中基因的表达值
humanExpr <- eset[match(rownames(dif), rownames(eset)), ]
humanExpr <- cbind(humanGeneInput[,"EntrezID"], humanExpr)
# 去除NA数据
humanGeneInput <- humanGeneInput[!is.na(humanGeneInput[, 1]),]
humanExpr <- humanExpr[!is.na(humanExpr[,1]),]
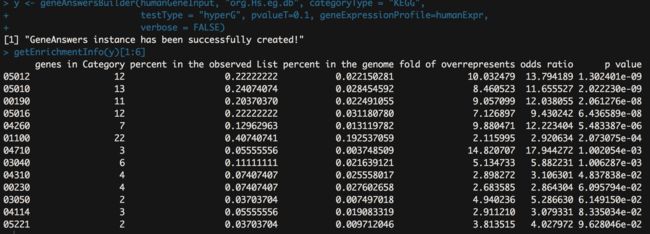
# KEGG通路的超几何检验
y <- geneAnswersBuilder(humanGeneInput, "org.Hs.eg.db", categoryType = "KEGG",
                        testType = "hyperG", pvalueT=0.1, geneExpressionProfile=humanExpr,
                        verbose = FALSE)
getEnrichmentInfo(y)[1:6]
biocLite("pheatmap")
library(pheatmap)
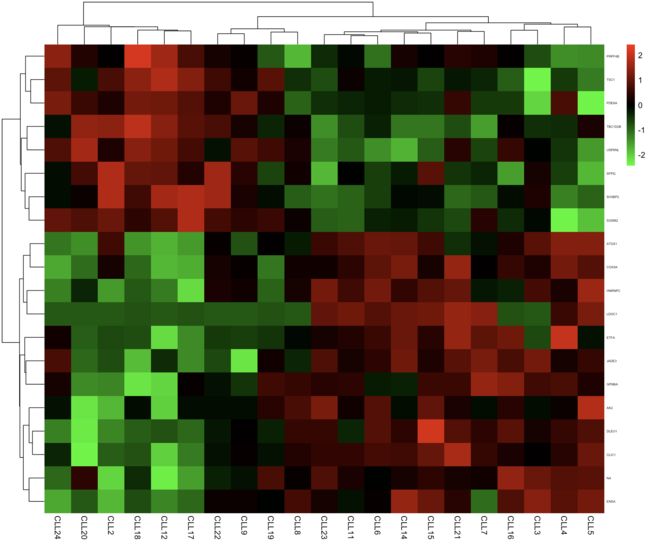
# 从基因表达矩阵中,选取差异表达基因对应的数据
selected <- eset[rownames(dif), ]
# 将selected矩阵每行的名称由探针组ID转换为对应的基因symbol
rownames(selected) <- dif$symbols
# 考虑显示问题,这里只画前20个基因的热图
pheatmap(selected[1:20,], color = colorRampPalette(c("green", "black", "red"))(100),
         fontsize_row = 4, scale = "row", border_color = NA)
biocLite("Rgraphviz")
library(Rgraphviz)
# 显著富集的GO term的DAG关系图
ghandle <- goDag(hgOver)
# 这个图太大,这里只能选一部分数据构建局部图
subGHandle <- subGraph(snodes=as.character(summary(hgOver)[,1]), graph = ghandle)
plot(subGHandle)
source("https://bioconductor.org/biocLite.R")
biocLite("KEGG.db")
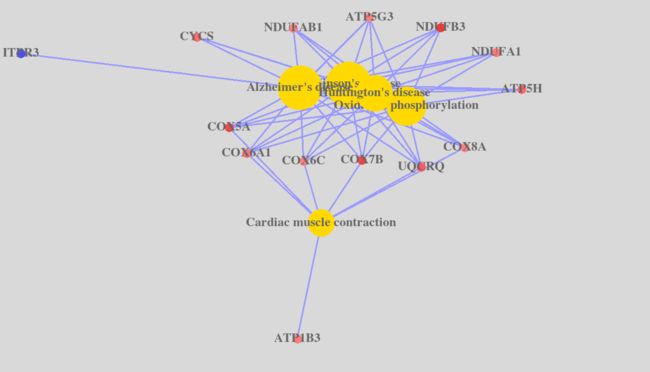
yy<- geneAnswersReadable(y)
geneAnswersConceptNet(yy, colorValueColumn = "logFC", centroidSize = "pvalue", output="interactive")
这里我报错了,这个网站解决问题http://planspace.org/2013/01/17/fix-r-tcltk-dependency-problem-on-mac/
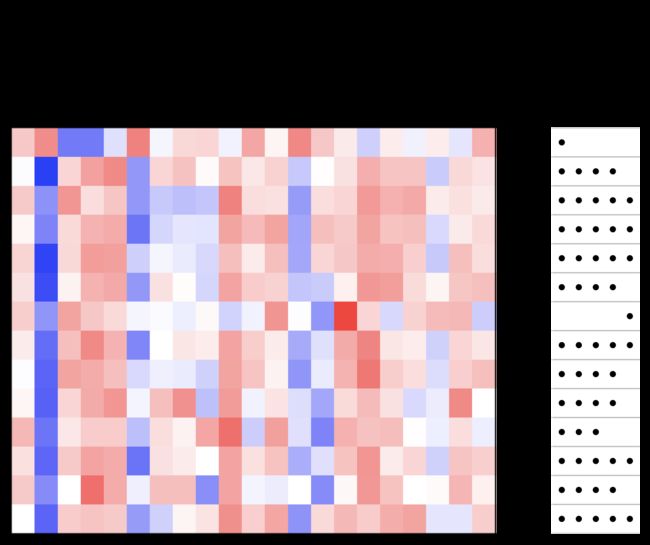
yyy<- geneAnswersSort(yy,sortBy = "pvalue")
geneAnswersHeatmap(yyy)
- 最后输出会话信息:
> sessionInfo()
R version 3.4.2 (2017-09-28)
Platform: x86_64-apple-darwin15.6.0 (64-bit)
Running under: macOS Sierra 10.12.6

Matrix products: default
BLAS: /System/Library/Frameworks/Accelerate.framework/Versions/A/Frameworks/vecLib.framework/Versions/A/libBLAS.dylib
LAPACK: /Library/Frameworks/R.framework/Versions/3.4/Resources/lib/libRlapack.dylib

locale:
[1] en_US.UTF-8/en_US.UTF-8/en_US.UTF-8/C/en_US.UTF-8/en_US.UTF-8

attached base packages:
 [1] grid      stats4    parallel  stats     graphics  grDevices utils     datasets  methods   base

other attached packages:
 [1] KEGG.db_3.2.3        Rgraphviz_2.22.0     pheatmap_1.0.8       GeneAnswers_2.20.0   RColorBrewer_1.1-2
 [6] Heatplus_2.24.0      MASS_7.3-47          RSQLite_2.0          RCurl_1.95-4.8       bitops_1.0-6
[11] igraph_1.1.2         GO.db_3.5.0          GOstats_2.44.0       graph_1.56.0         Category_2.44.0
[16] Matrix_1.2-12        hgu95av2.db_3.2.3    org.Hs.eg.db_3.5.0   annotate_1.56.1      XML_3.98-1.9
[21] hgu95av2probe_2.18.0 AnnotationDbi_1.40.0 IRanges_2.12.0       S4Vectors_0.16.0     hgu95av2cdf_2.18.0
[26] CLL_1.18.0           gcrma_2.50.0         affy_1.56.0          Biobase_2.38.0       BiocGenerics_0.24.0
[31] limma_3.34.1

loaded via a namespace (and not attached):
 [1] matrixStats_0.52.2         bit64_0.9-7                GenomeInfoDb_1.14.0        tools_3.4.2
 [5] backports_1.1.1            affyio_1.48.0              rpart_4.1-11               Hmisc_4.0-3
 [9] DBI_0.7                    lazyeval_0.2.1             colorspace_1.3-2           nnet_7.3-12
[13] gridExtra_2.3              DESeq2_1.18.1              bit_1.1-12                 compiler_3.4.2
[17] preprocessCore_1.40.0      htmlTable_1.9              DelayedArray_0.4.1         scales_0.5.0
[21] checkmate_1.8.5            genefilter_1.60.0          RBGL_1.54.0                stringr_1.2.0
[25] digest_0.6.12              foreign_0.8-69             DOSE_3.4.0                 AnnotationForge_1.20.0
[29] XVector_0.18.0             base64enc_0.1-3            pkgconfig_2.0.1            htmltools_0.3.6
[33] htmlwidgets_0.9            rlang_0.1.4                BiocInstaller_1.28.0       BiocParallel_1.12.0
[37] acepack_1.4.1              GOSemSim_2.4.0             magrittr_1.5               GenomeInfoDbData_0.99.1
[41] Formula_1.2-2              Rcpp_0.12.14               munsell_0.4.3              stringi_1.1.6
[45] yaml_2.1.14                SummarizedExperiment_1.8.0 zlibbioc_1.24.0            plyr_1.8.4
[49] qvalue_2.10.0              blob_1.1.0                 DO.db_2.9                  lattice_0.20-35
[53] Biostrings_2.46.0          splines_3.4.2              locfit_1.5-9.1             knitr_1.17
[57] tcltk_3.4.2                fgsea_1.4.0                GenomicRanges_1.30.0       geneplotter_1.56.0
[61] reshape2_1.4.2             fastmatch_1.1-0            downloader_0.4             latticeExtra_0.6-28
[65] data.table_1.10.4-3        gtable_0.2.0               ggplot2_2.2.1              xtable_1.8-2
[69] survival_2.41-3            tibble_1.3.4               rvcheck_0.0.9              memoise_1.1.0
[73] cluster_2.0.6              GSEABase_1.40.1
参考文献
http://www.flypeom.site/bioinformatics/r/2017/10/09/microArray-data-analysis/

