吴恩达机器学习CS229A_EX5_偏差与方差_Python3
本次实验使用 EX1 写过的线性回归,主要是分析理解欠拟合(高偏差 bias)和过拟合(高方差 variance)。
因为编写的代码基本在 EX1 和 EX2 都有涉及,主要记录实验过程,关于代码的详细注解可以参考:
吴恩达机器学习CS229A_EX1_线性回归_Python3 和 吴恩达机器学习CS229A_EX2_逻辑回归与正则化_Python3
数据集
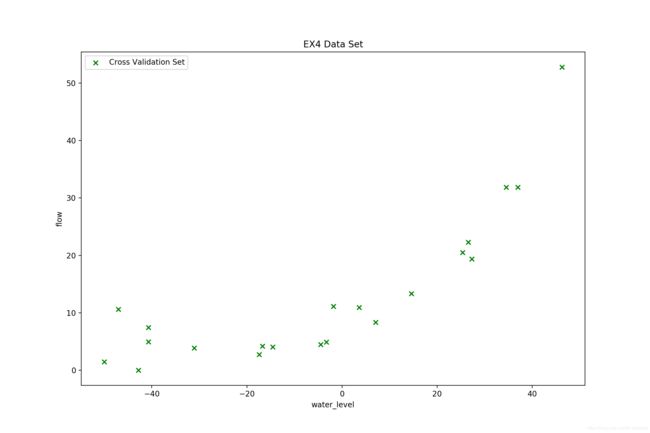
训练集 12 个样本,验证集和测试集都是 21 个样本,绘图观察一下:
线性回归
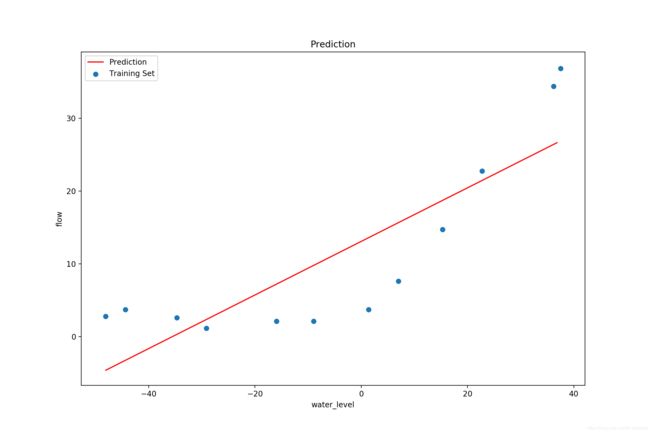
首先使用线性回归拟合,没有正则化限制:
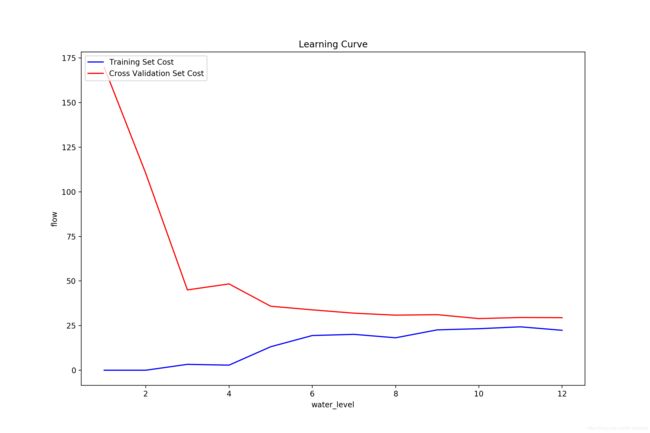
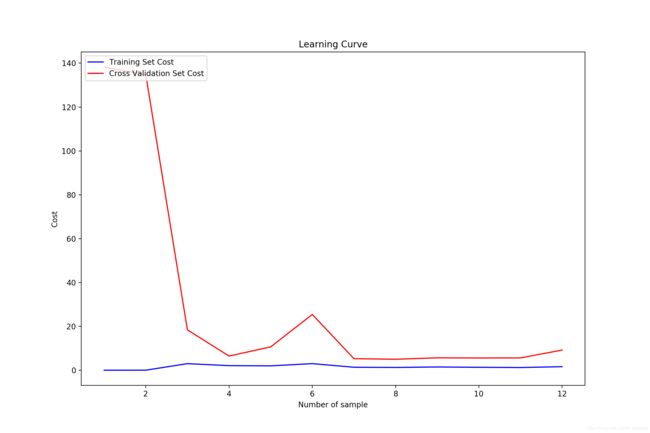
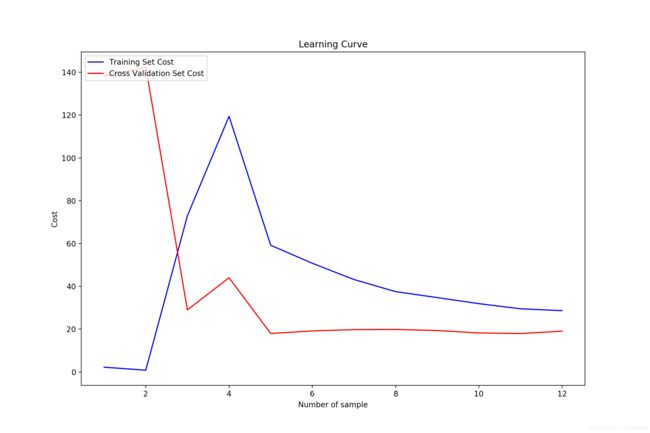
绘制学习曲线(这里横纵轴的标注忘了改了):
可以看到,仅仅使用了 6 个样本之后,训练集和验证集的 cost 就几乎不变了,增加更多的样本也无济于事,而且验证集和训练集的 cost 接近,这就是典型的欠拟合现象。
多项式回归(lamda = 0)
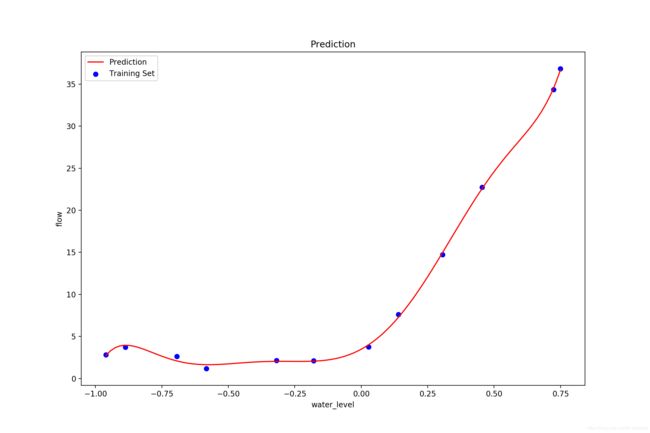
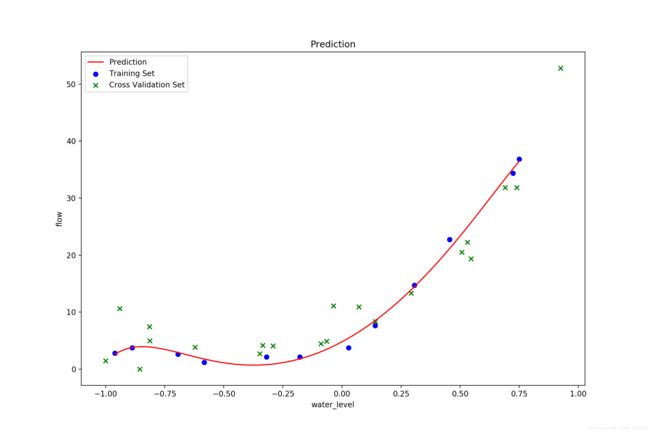
接着用多项式回归拟合,不加正则化限制:
这里比对了一下用正规方程法求解得到的图像,和梯度下降的结果还是非常近似的,不过这里说明取到 8 次方的多项式回归还做不到完全通过图中的 12 个点:
绘制学习曲线(这里横纵轴的标注忘了改了):
这里看到,训练集的 cost 非常小,而在验证集的表现相比较要差的多,而且有一定的波动,这就是明显的过拟合的表现。
Cost-Lamda
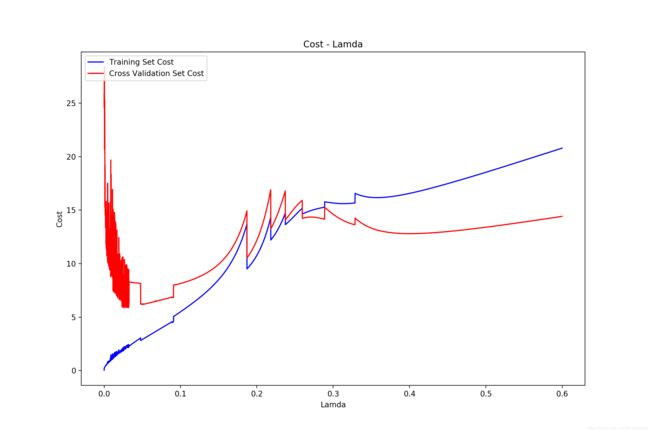
我们尝试找到最好的 lamda,绘制 cost - lamda 图像,步长为 0.001:
步长为 0.0001:
可以看到最优的 lamda 大约在 0.02 取得,这时训练得到的模型泛化能力最强。
多项式回归(lamda != 0)
最后再附上几个加了正则化的多项式回归。
lamda = 0.02,理想的参数设置:
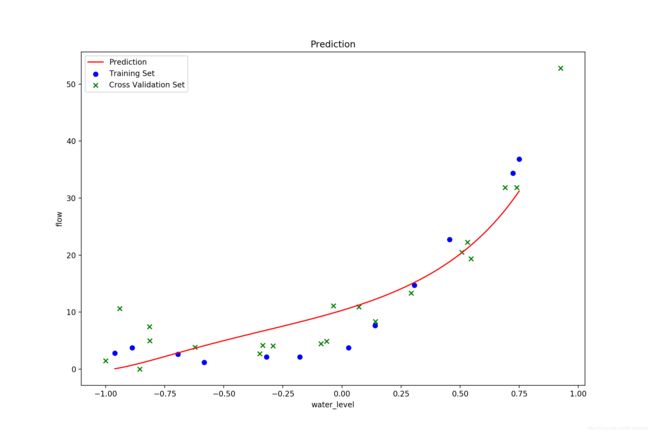
lamda = 1,正则化惩罚过大, 欠拟合:
完整代码
最后值得一提的是采用多项式回归时,要注意对特征做归一化,不然可能收敛的效果很差,这里笔者采用的方式是直接将原数据收缩到 -1~+1 范围内,而没有处理高次项,实际来看效果也是不错的。
import numpy as np
import matplotlib.pyplot as plt
from scipy.io import loadmat
from scipy.optimize import minimize

def loadData(filename):
    return loadmat(filename)

# 加载并初始化线性回归的数据集集与参数
def initData_Lin(data):
    theta = np.ones(2)
    # 交叉验证集
    Xval = data['Xval']
    Xval = np.insert(Xval, 0, values=np.ones(Xval.shape[0]), axis=1)
    yval = data['yval']
    # 测试集
    Xtest = data['Xtest']
    Xtest = np.insert(Xtest, 0, values=np.ones(Xtest.shape[0]), axis=1)
    ytest = data['ytest']
    # 训练集
    X = data['X']
    X = np.insert(X, 0, values=np.ones(X.shape[0]), axis=1)
    y = data['y']
    return theta, X, y, Xval, yval, Xtest, ytest

# 加载并初始化多项式回归的测试集和参数
def initData_Poly(data, degree = 8):
    theta = np.zeros(degree + 1)
    # 交叉验证集
    Xval = data['Xval']
    Xval /= 50
    Xval = np.insert(Xval, 0, values=np.ones(Xval.shape[0]), axis=1)
    for i in range(2, degree + 1):
        Xval = np.insert(Xval, i, values=np.power(Xval[:,1], i), axis=1)
    yval = data['yval']
    # 测试集
    Xtest = data['Xtest']
    Xtest /= 50
    Xtest = np.insert(Xtest, 0, values=np.ones(Xtest.shape[0]), axis=1)
    for i in range(2, degree + 1):
        Xtest = np.insert(Xtest, i, values=np.power(Xtest[:,1], i), axis=1)
    ytest = data['ytest']
    # 训练集
    X = data['X']
    X /= 50
    X = np.insert(X, 0, values=np.ones(X.shape[0]), axis=1)
    for i in range(2, degree + 1):
        X = np.insert(X, i, values=np.power(X[:,1], i), axis=1)
    y = data['y']
    return theta, X, y, Xval, yval, Xtest, ytest

# 展示数据集
def showData(data):
    fig, ax = plt.subplots(figsize=(12, 8))
    ax.scatter(data['X'], data['y'], c = 'b', label = 'Training Set', marker = 'o')
    ax.scatter(data['Xval'], data['yval'], c = 'g', label= 'Cross Validation Set', marker = 'x')
    ax.scatter(data['Xtest'], data['ytest'], c = 'r', label= 'Test Set', marker = '*')
    ax.legend(loc=2)
    ax.set_xlabel('water_level')
    ax.set_ylabel('flow')
    ax.set_title('EX4 Data Set')
    plt.show()

#############################################################################

def costReg(theta, X, y, lamda):
    m = len(y)
    n = len(theta)
    inner = X @ theta.reshape(n,1) - y
    J = np.sum(inner.T @ inner) / (2.0 * m)
    reg = (lamda / (2.0 * m)) * np.sum(theta.reshape(1,n) @ theta.reshape(n,1))
    return J + reg

def gradientReg(theta, X, y, lamda):
    m = len(y)
    n = len(theta)
    grad = (1.0 / m) * (X @ theta.reshape(n,1) - y).T @ X
    grad = grad.reshape(1,n)[0]
    grad[1] += (lamda / m) * theta[1]
    return grad

def train(theta, X, y, lamda):
    return minimize(fun=costReg, x0=theta, args=(X, y, lamda), method='TNC', jac=gradientReg, options={'disp': True})

def normalEqn(X, y):
    return np.linalg.inv(X.T@X)@X.T@y

#############################################################################

def showRes(res, data):
    x = np.linspace(data['X'].min(), data['X'].max(), 100)
    f = res.x[0] + (res.x[1] * x) + (res.x[2] * np.power(x,2)) + (res.x[3] * np.power(x,3)) + \
        (res.x[4] * np.power(x, 4)) + (res.x[5] * np.power(x,5)) + (res.x[6] * np.power(x,6))+ \
        (res.x[7] * np.power(x, 7)) + (res.x[8] * np.power(x,8))
    fig, ax = plt.subplots(figsize=(12, 8))
    ax.plot(x, f, 'r', label='Prediction')
    ax.scatter(data['X'], data['y'], c = 'b', label = 'Training Set', marker = 'o')
    ax.scatter(data['Xval'], data['yval'], c='g', label='Cross Validation Set', marker='x')
    #ax.scatter(data['Xtest'], data['ytest'], c='r', label='Test Set', marker='*')
    ax.legend(loc=2)
    ax.set_xlabel('water_level')
    ax.set_ylabel('flow')
    ax.set_title('Prediction')
    plt.show()

def showLearingCurve(theta, X, y, Xval, yval, lamda):
    m = X.shape[0]
    n = X.shape[1]
    print(m)
    cost_training = np.zeros(m + 1)
    cost_CV = np.zeros(m + 1)
    print(cost_CV)
    for i in range(1, m + 1):
        print(i)
        X_in = X[0:i,:].reshape(i,n)
        y_in = y[0:i,:].reshape(i,1)
        res = train(theta, X_in, y_in, lamda)
        print(res.x)
        cost_training[i] = costReg(res.x, X_in, y_in, lamda)
        cost_CV[i] = costReg(res.x, Xval, yval, lamda)
    x = range(1, m + 1)
    fig, ax = plt.subplots(figsize=(12, 8))
    ax.plot(x, cost_training[1:], c = 'b', label = 'Training Set Cost')
    ax.plot(x, cost_CV[1:], c = 'r', label = 'Cross Validation Set Cost')
    ax.legend(loc=2)
    ax.set_xlabel('Number of sample')
    ax.set_ylabel('Cost')
    ax.set_title('Learning Curve')
    plt.show()

def show_cost_lamda(theta, X, y, Xval, yval):
    lamda = np.arange(0,1,0.001)
    cost_training = np.zeros(1000)
    cost_CV = np.zeros(1000)
    item = 0
    for l in lamda:
        res = train(theta, X, y, l)
        cost_training[item] = costReg(res.x, X, y, l)
        cost_CV[item] = costReg(res.x, Xval, yval, l)
        item += 1
    fig, ax = plt.subplots(figsize=(12, 8))
    ax.plot(lamda, cost_training[:], c='b', label='Training Set Cost')
    ax.plot(lamda, cost_CV[:], c='r', label='Cross Validation Set Cost')
    ax.legend(loc=2)
    ax.set_xlabel('Lamda')
    ax.set_ylabel('Cost')
    ax.set_title('Cost - Lamda')
    plt.show()


lamda = 1
data = loadData('ex5data1.mat')
theta, X, y, Xval, yval, Xtest, ytest = initData_Poly(data)
#res = train(theta, X, y, lamda)
#showData(data)
#showRes(res, data)
#showLearingCurve(theta, X, y, Xval, yval, lamda)
#show_cost_lamda(theta, X, y, Xval, yval)

