python机器学习经典实例-学习笔记2
标记编码方法
1.在监督学习中,经常需要处理各种各样的标记。这些标记可能是数字,也可能是单词。
【补充:sklearn 中的 name.fit(variable)的意思是提取变量variable的特征,即将相同的数据进行合并。】
label_encoder = preprocessing.LabelEncoder()
input_classes = ['audi', 'ford', 'audi', 'toyota', 'ford', 'bmw']
label_encoder.fit(input_classes)#
print ("\nClass mapping:")
print(label_encoder.classes_)
for i, item in enumerate(label_encoder.classes_):
    print (item, '-->', i)

for i, item in enumerate(input_classes):
    print (item, '-->', i)
第3行:合并变量input_classes中的相同的变量。
第5行:输出fit后的结果为: ['audi' 'bmw' 'ford' 'toyota']
第一个for循环输出经过fit后的结果:
audi --> 0
bmw --> 1
ford --> 2
toyota --> 3
第二个for循环是未经过fit的结果(完全输出):
audi --> 0
ford --> 1
audi --> 2
toyota --> 3
ford --> 4
bmw --> 5
可以看出0和2、1和4的变量是重复的。
2. 就像前面结果显示的那样,单词被转换成从0开始的索引值。现在,如果你遇到一组标记,
就可以非常轻松地转换它们了
标签的查询
labels = ['toyota', 'ford', 'audi']#查询索引的标签
encoded_labels = label_encoder.transform(labels)#转换成总标签label_encoder对应的位置
print ("\nLabels =", labels)
print ("Encoded labels =", list(encoded_labels))
输出结果
Labels = ['toyota', 'ford', 'audi']
Encoded labels = [3, 2, 0]
3. 还可以通过数字反转回单词的功能检查结果的正确性
encoded_labels = [2, 1, 0, 3, 1]
decoded_labels = label_encoder.inverse_transform(encoded_labels)
print ("\nEncoded labels =", encoded_labels)
print ("Decoded labels =", list(decoded_labels))
输出结果
Encoded labels = [2, 1, 0, 3, 1]
Decoded labels = ['ford', 'bmw', 'audi', 'toyota', 'bmw']
创建线性回归器
线性回归的目标是提取输入变量与输出变量的关联线性模型,这就要求实际输出与线性方程
预测的输出的残差平方和(sum of squares of differences)最小化。这种方法被称为普通最小二乘法(Ordinary Least Squares,OLS)。
接下来看看如何用Python建立线性回归模型。
代码资料获取:
http://weixin.qq.com/r/zERKUijEMXVOrWwx9xHe (二维码自动识别)
飓风科技官网:机器学习>代码1
- 取训练和测试的数据:
把输入数据加载到变量X和y,其中X是数据,y是标记。在代码的for循环体中,我们解析每
行数据,用逗号分割字段。然后,把字段转化为浮点数,并分别保存到变量X和y中。
import numpy as np

X = []
y = []
with open('C://Users/imace/Desktop/python_execise/Chapter01/data_singlevar.txt'
          , 'r') as f:
    for line in f.readlines():
        xt, yt = [float(i) for i in line.split(',')]
        X.append(xt)
        y.append(yt)
定义列表X、Y存储变量
读取data_singlevar.txt 文件里的数据
补充:.readlines() 自动将文件内容分析成一个行的列表,该列表可以由 Python 的 for … in … 结构进行处理。另一方面,.readline() 每次只读取一行,通常比 .readlines() 慢得多。仅当没有足够内存可以一次读取整个文件时,才应该使用 .readline(),读取的文件类型是字符串。
split():拆分字符串。通过指定分隔符对字符串进行切片,并返回分割后的字符串列表(list)
name.append() 方法用于在列表末尾添加新的对象。
- 验证算法-训练数据//测试数据
建立机器学习模型时,需要用一种方法来验证模型,检查模型是否达到一定的满意度
(satisfactory level)。为了实现这个方法,把数据分成两组:训练数据集(training dataset)与测试数据集(testing dataset)。训练数据集用来建立模型,测试数据集用来验证模型对未知数据的学习效果。因此,先把数据分成训练数据集与测试数据集:
# Train/test split
num_training = int(0.8 * len(X))
num_test = len(X) - num_training

# Training data
X_train = np.array(X[:num_training]).reshape((num_training,1))
y_train = np.array(y[:num_training])

# Test data
X_test = np.array(X[num_training:]).reshape((num_test,1))
y_test = np.array(y[num_training:])
这里用80%的数据作为训练数据集,其余20%的数据作为测试数据集。
X[:num_training]
X既不是行也不是列向量。虽然我们可能知道它应该被解释为目标值的一维数组,fit()但是现在还不够聪明,不知道该如何处理它。因此.reshape((num_training,1))将其定义成成一列(我试了:一行不可以。原因未知)
- 3. 现在已经准备好训练模型。接下来创建一个回归器对象
调用线性回归模块
# Create linear regression object
from sklearn import linear_model

linear_regressor = linear_model.LinearRegression()

# Train the model using the training sets
linear_regressor.fit(X_train, y_train)
fit()可以说是调用的通用方法。fit(X),表示用数据X来训练某种模型。 函数返回值一般为调用fit方法的对象本身。fit(X,y=None)为无监督学习算法,fit(X,Y)为监督学习算法。
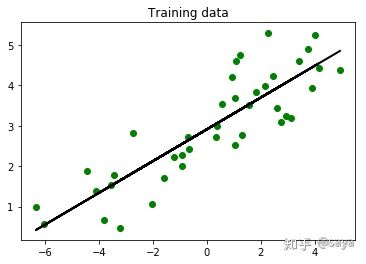
- 4. 我们利用训练数据集训练了线性回归器。向fit方法提供输入数据即可训练模型。用下面的代码看看它如何拟合。
import matplotlib.pyplot as plt
y_train_pred = linear_regressor.predict(X_train)
plt.figure()
plt.scatter(X_train, y_train, color='green')
plt.plot(X_train, y_train_pred, color='red', linewidth=2)
plt.title('Training data')
plt.show()
如图
训练结果
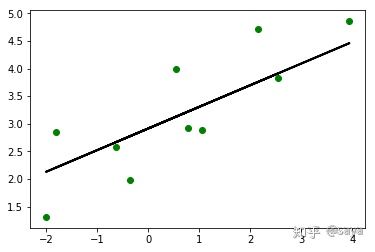
- 接下来用模型对测试数据集进行预测,然后画出来看。
y_test_pred = linear_regressor.predict(X_test)
# Plot outputs
import matplotlib.pyplot as plt

plt.scatter(X_test, y_test, color='green')
plt.plot(X_test, y_test_pred, color='black', linewidth=2)
#plt.xticks(())
#plt.yticks(())
plt.show()
测试结果
- 衡量回归器拟合效果的重要指标
- 平均绝对误差(mean absolute error):这是给定数据集的所有数据点的绝对误差平均值。
- 均方误差(mean squared error):这是给定数据集的所有数据点的误差的平方的平均值。这是最流行的指标之一。
- 中位数绝对误差(median absolute error):这是给定数据集的所有数据点的误差的中位数。这个指标的主要优点是可以消除异常值(outlier)的干扰。测试数据集中的单个坏点不会影响整个误差指标,均值误差指标会受到异常点的影响。
- 解释方差分(explained variance score):这个分数用于衡量我们的模型对数据集波动的解释能力。如果得分1.0分,那么表明我们的模型是完美的。
- R方得分(R2 score):这个指标读作“R方”,是指确定性相关系数,用于衡量模型对未知样本预测的效果。最好的得分是1.0,值也可以是负数。
# Measure performance
import sklearn.metrics as sm
print ("Mean absolute error =", round(sm.mean_absolute_error(y_test, y_test_pred), 2) )
print ("Mean squared error =", round(sm.mean_squared_error(y_test, y_test_pred), 2) )
print ("Median absolute error =", round(sm.median_absolute_error(y_test, y_test_pred), 2) )
print ("Explain variance score =", round(sm.explained_variance_score(y_test, y_test_pred), 2) )
print ("R2 score =", round(sm.r2_score(y_test, y_test_pred), 2))
结果out:
Mean absolute error = 0.54
Mean squared error = 0.38
Median absolute error = 0.54
Explain variance score = 0.68
R2 score = 0.68
- 模型的存储与调用
在机器学习中,我们常常需要把训练好的模型存储起来,这样在进行决策时直接将模型读出,而不需要重新训练模型,这样就大大节约了时间。Python提供的pickle模块就很好地解决了这个问题,它可以序列化对象并保存到磁盘中,并在需要的时候读取出来,任何对象都可以执行序列化操作。
Pickle模块中最常用的函数为:
(1)pickle.dump(obj, file, [,protocol])
函数的功能:将obj对象序列化存入已经打开的file中。
参数讲解:
- obj:想要序列化的obj对象。
- file:文件名称。
- protocol:序列化使用的协议。如果该项省略,则默认为0。如果为负值或HIGHEST_PROTOCOL,则使用最高的协议版本。
# Model persistence
import  pickle

output_model_file = '3_model_linear_regr.pkl'

with open(output_model_file, 'wb') as f:
    pickle.dump(linear_regressor, f)

with open(output_model_file, 'rb') as f:
    model_linregr = pickle.load(f)

y_test_pred_new = model_linregr.predict(X_test)
print ("\nNew mean absolute error =", round(sm.mean_absolute_error(y_test, y_test_pred_new), 2) )
调用结果out:
New mean absolute error = 0.54
未完待续。。。。。。
下一节--岭回归器、多项式回归器
2019/3/20


