istio1.0.4快速部署与体验
截至目前istio版本已更新到1.0.4,它有非常丰富的文档和中文翻译,这里基于1.0.4的英文版搭配1.0版本的中文文档快速把istio相关部署和示例跑一遍并留下记录和说明。
在minikube上部署
启动minikube
此处已启用了apiserver.admission-control中的MutatingAdmissionWebhook,ValidatingAdmissionWebhook这两个非常重要
minikube start \
    --extra-config=controller-manager.cluster-signing-cert-file="/var/lib/localkube/certs/ca.crt" \
    --extra-config=controller-manager.cluster-signing-key-file="/var/lib/localkube/certs/ca.key" \
    --extra-config=apiserver.admission-control="NamespaceLifecycle,LimitRanger,ServiceAccount,PersistentVolumeLabel,DefaultStorageClass,DefaultTolerationSeconds,MutatingAdmissionWebhook,ValidatingAdmissionWebhook,ResourceQuota" \
    --kubernetes-version=v1.10.0
由于istio套件需要4G左右内存,先确保启动的虚拟机内存是超过4G的否则会在后续部署中提示资源不足。
安装
创建crd
kubectl apply -f install/kubernetes/helm/istio/templates/crds.yaml
安装istio
在新集群使用如下脚本安装istio并启用Sidecar之间的双向TLS认证
$ kubectl apply -f install/kubernetes/istio-demo-auth.yaml
在已有集群可使用如下方式安装(与其他方式互斥,本例中使用):
$ kubectl apply -f install/kubernetes/istio-demo.yaml
服务检查
确保如下service都已被创建,
必选:istio-pilot, istio-ingressgateway, istio-policy, istio-telemetry, prometheus, istio-galley
可选:istio-sidecar-injector
同时如果集群不支持外部LB,那么istio-ingress和istio-ingressgateway的EXTERNAL-IP的状态会显示"pending",随后你可以通过Nodeport的方式替代访问。
➜  istio-1.0.4 kubectl get svc -n istio-system
NAME                     TYPE           CLUSTER-IP       EXTERNAL-IP   PORT(S)                                                                                                                   AGE
grafana                  ClusterIP      10.110.143.147           3000/TCP                                                                                                                  15h
istio-citadel            ClusterIP      10.111.151.255           8060/TCP,9093/TCP                                                                                                         15h
istio-egressgateway      ClusterIP      10.96.48.231             80/TCP,443/TCP                                                                                                            15h
istio-galley             ClusterIP      10.103.89.68             443/TCP,9093/TCP                                                                                                          15h
istio-ingressgateway     LoadBalancer   10.109.43.167         80:31380/TCP,443:31390/TCP,31400:31400/TCP,15011:30101/TCP,8060:30265/TCP,853:30858/TCP,15030:30789/TCP,15031:31420/TCP   15h
istio-pilot              ClusterIP      10.106.104.93            15010/TCP,15011/TCP,8080/TCP,9093/TCP                                                                                     15h
istio-policy             ClusterIP      10.96.98.170             9091/TCP,15004/TCP,9093/TCP                                                                                               15h
istio-sidecar-injector   ClusterIP      10.98.91.84              443/TCP                                                                                                                   15h
istio-telemetry          ClusterIP      10.99.100.31             9091/TCP,15004/TCP,9093/TCP,42422/TCP                                                                                     15h
jaeger-agent             ClusterIP      None                     5775/UDP,6831/UDP,6832/UDP                                                                                                15h
jaeger-collector         ClusterIP      10.109.10.64             14267/TCP,14268/TCP                                                                                                       15h
jaeger-query             ClusterIP      10.106.59.243            16686/TCP                                                                                                                 15h
prometheus               ClusterIP      10.103.242.95            9090/TCP                                                                                                                  15h
servicegraph             ClusterIP      10.105.99.201            8088/TCP                                                                                                                  15h
tracing                  ClusterIP      10.101.82.172            80/TCP                                                                                                                    15h
zipkin                   ClusterIP      10.108.39.236            9411/TCP
pod检查
确保如下pod状态都是running:
必选:istio-pilot-, istio-ingressgateway-, istio-egressgateway-, istio-policy-, istio-telemetry-, istio-citadel-, prometheus-, istio-galley-
可选: istio-sidecar-injector-*.
➜  istio-1.0.4 kubectl get pod -n istio-system
NAME                                      READY     STATUS    RESTARTS   AGE
grafana-9cfc9d4c9-sv6dc                   1/1       Running   1          15h
istio-citadel-74df865579-5sfwb            1/1       Running   1          15h
istio-egressgateway-58df7c4d8-bgmxj       1/1       Running   1          15h
istio-galley-8487989b9b-vl8tf             1/1       Running   1          15h
istio-ingressgateway-6fc88db97f-fctf9     1/1       Running   1          15h
istio-pilot-74bb7dcdd-dj79t               2/2       Running   0          14h
istio-policy-58878f57fb-gxstx             2/2       Running   2          15h
istio-sidecar-injector-5cfcf6dd86-x5kmn   1/1       Running   1          15h
istio-telemetry-bf5558589-m5k9z           2/2       Running   3          15h
istio-tracing-ff94688bb-zsd9p             1/1       Running   2          15h
prometheus-f556886b8-wh5hd                1/1       Running   1          15h
servicegraph-55d57f69f5-lmnfw             1/1       Running   3          15h
部署demo应用
检查istio-injection状态
➜  istio-1.0.4 kubectl get ns -L istio-injection
NAME            STATUS    AGE       ISTIO-INJECTION
default         Active    38d
demo-webshell   Active    37d
istio-system    Active    15h       disabled
kong            Active    37d
kube-public     Active    38d
kube-system     Active    38d
上述说明所有ns都尚未启用,要么启用要么用istioctl进行设置
启用istio-injection
➜  istio-1.0.4 kubectl label namespace default istio-injection=enabled
namespace "default" labeled
➜  istio-1.0.4 kubectl get ns -L istio-injection
NAME            STATUS    AGE       ISTIO-INJECTION
default         Active    38d       enabled
demo-webshell   Active    37d
istio-system    Active    15h       disabled
kong            Active    37d
kube-public     Active    38d
kube-system     Active    38d
部署应用
如果已启用了istio-injection,可直接部署:
kubectl apply -f samples/bookinfo/platform/kube/bookinfo.yaml
这里需要等待一会,拉取镜像并启动需要一定时间
➜  istio-1.0.4 kubectl get pod
NAME                             READY     STATUS     RESTARTS   AGE
details-v1-6865b9b99d-7lbkx      0/2       Init:0/1   0          2m
hello-minikube-cbf7c5d59-ksrzv   1/1       Running    2          37d
http-svc-7dd9588c5-nbtjd         1/1       Running    2          37d
productpage-v1-f8c8fb8-rkdtg     0/2       Init:0/1   0          2m
ratings-v1-77f657f55d-9h46f      0/2       Init:0/1   0          2m
reviews-v1-6b7f6db5c5-z86kb      0/2       Init:0/1   0          2m
reviews-v2-7ff5966b99-r2pbz      0/2       Init:0/1   0          2m
reviews-v3-5df889bcff-ddshq      0/2       Init:0/1   0          2m

➜  istio-1.0.4 kubectl get pod
NAME                             READY     STATUS            RESTARTS   AGE
details-v1-6865b9b99d-7lbkx      2/2       Running           0          7m
hello-minikube-cbf7c5d59-ksrzv   1/1       Running           2          37d
http-svc-7dd9588c5-nbtjd         1/1       Running           2          37d
productpage-v1-f8c8fb8-rkdtg     0/2       PodInitializing   0          7m
ratings-v1-77f657f55d-9h46f      0/2       PodInitializing   0          7m
reviews-v1-6b7f6db5c5-z86kb      0/2       PodInitializing   0          7m
reviews-v2-7ff5966b99-r2pbz      0/2       PodInitializing   0          7m
reviews-v3-5df889bcff-ddshq      0/2       PodInitializing   0          7m

Events:
  Type    Reason                 Age   From               Message
  ----    ------                 ----  ----               -------
  Normal  Scheduled              22m   default-scheduler  Successfully assigned reviews-v3-5df889bcff-ddshq to minikube
  Normal  SuccessfulMountVolume  22m   kubelet, minikube  MountVolume.SetUp succeeded for volume "istio-envoy"
  Normal  SuccessfulMountVolume  22m   kubelet, minikube  MountVolume.SetUp succeeded for volume "istio-certs"
  Normal  SuccessfulMountVolume  22m   kubelet, minikube  MountVolume.SetUp succeeded for volume "default-token-px6lt"
  Normal  Pulling                22m   kubelet, minikube  pulling image "docker.io/istio/proxy_init:1.0.4"
  Normal  Pulled                 19m   kubelet, minikube  Successfully pulled image "docker.io/istio/proxy_init:1.0.4"
  Normal  Created                19m   kubelet, minikube  Created container
  Normal  Started                19m   kubelet, minikube  Started container
  Normal  Pulling                19m   kubelet, minikube  pulling image "istio/examples-bookinfo-reviews-v3:1.8.0"
  Normal  Pulled                 1m    kubelet, minikube  Successfully pulled image "istio/examples-bookinfo-reviews-v3:1.8.0"
  Normal  Created                1m    kubelet, minikube  Created container
  Normal  Started                1m    kubelet, minikube  Started container
  Normal  Pulled                 1m    kubelet, minikube  Container image "docker.io/istio/proxyv2:1.0.4" already present on machine
  Normal  Created                1m    kubelet, minikube  Created container
  Normal  Started                1m    kubelet, minikube  Started container
检查应用状态
➜  istio-1.0.4 kubectl get pod
NAME                             READY     STATUS    RESTARTS   AGE
details-v1-6865b9b99d-7lbkx      2/2       Running   0          26m
hello-minikube-cbf7c5d59-ksrzv   1/1       Running   2          37d
http-svc-7dd9588c5-nbtjd         1/1       Running   2          37d
productpage-v1-f8c8fb8-rkdtg     2/2       Running   0          26m
ratings-v1-77f657f55d-9h46f      2/2       Running   0          26m
reviews-v1-6b7f6db5c5-z86kb      2/2       Running   0          26m
reviews-v2-7ff5966b99-r2pbz      2/2       Running   0          26m
reviews-v3-5df889bcff-ddshq      2/2       Running   0          26m
➜  istio-1.0.4 kubectl get svc
NAME             TYPE        CLUSTER-IP       EXTERNAL-IP   PORT(S)          AGE
details          ClusterIP   10.101.160.111           9080/TCP         32m
hello-minikube   NodePort    10.109.31.46             8080:31693/TCP   37d
http-svc         NodePort    10.98.61.30              80:31313/TCP     37d
kubernetes       ClusterIP   10.96.0.1                443/TCP          38d
productpage      ClusterIP   10.99.147.94             9080/TCP         32m
ratings          ClusterIP   10.101.28.73             9080/TCP         32m
reviews          ClusterIP   10.103.237.25            9080/TCP         32m
确定ingress的IP和端口
再次确定对外部负载均衡器的支持
➜  istio-1.0.4 kubectl get svc istio-ingressgateway -n istio-system
NAME                   TYPE           CLUSTER-IP      EXTERNAL-IP   PORT(S)                                                                                                                   AGE
istio-ingressgateway   LoadBalancer   10.109.43.167        80:31380/TCP,443:31390/TCP,31400:31400/TCP,15011:30101/TCP,8060:30265/TCP,853:30858/TCP,15030:30789/TCP,15031:31420/TCP   16h
➜  istio-1.0.4
EXTERNAL-IP 的状态说明我们确实需要通过NodePort访问
先确定端口:
export INGRESS_PORT=$(kubectl -n istio-system get service istio-ingressgateway -o jsonpath='{.spec.ports[?(@.name=="http2")].nodePort}')
export SECURE_INGRESS_PORT=$(kubectl -n istio-system get service istio-ingressgateway -o jsonpath='{.spec.ports[?(@.name=="https")].nodePort}')
确定Minikube中的Ingress IP
export INGRESS_HOST=$(minikube ip)
设置 GATEWAY_URL
$ export GATEWAY_URL=$INGRESS_HOST:$INGRESS_PORT
为应用定义ingress gateway
➜  istio-1.0.4 kubectl apply -f samples/bookinfo/networking/bookinfo-gateway.yaml
gateway "bookinfo-gateway" created
virtualservice "bookinfo" created
➜  istio-1.0.4 kubectl get gateway
NAME               AGE
bookinfo-gateway   49s
设置GATEWAY_URL
➜  istio-1.0.4 export GATEWAY_URL=$INGRESS_HOST:$INGRESS_PORT
➜  istio-1.0.4 echo $GATEWAY_URL
192.168.99.100:31380
检查服务是否运行成功
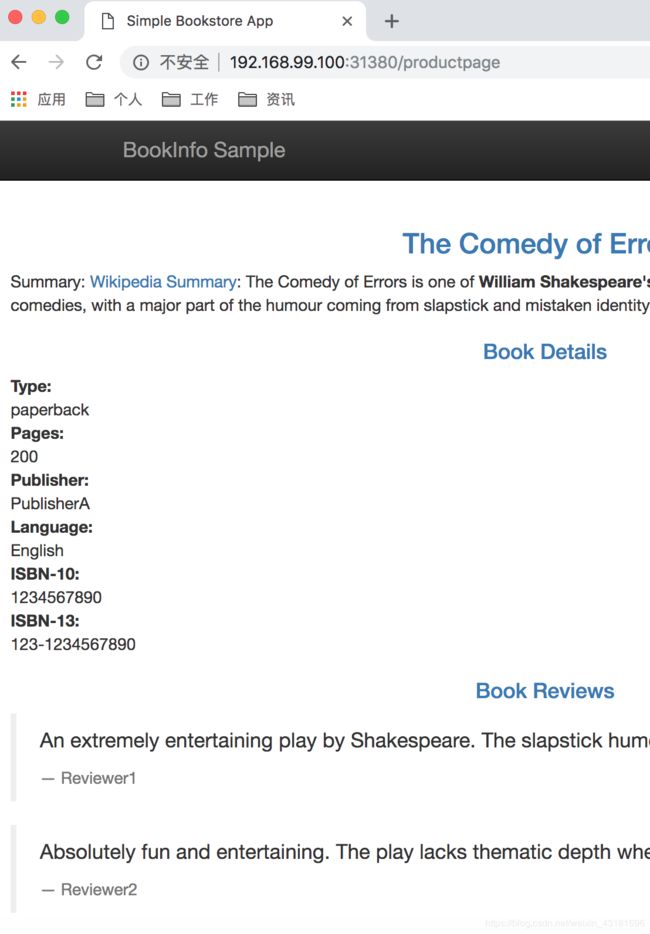
curl -o /dev/null -s -w "%{http_code}\n" http://${GATEWAY_URL}/productpage
在浏览器中访问,验证颜色是否真的不同:
示例-智能路由
3个任务:
- 请求路由任务首先会把 Bookinfo 应用的进入流量导向 reviews 服务的 v1 版本。接下来会把特定用户的请求发送给 v2 版本,其他用户则不受影响。
- 故障注入任务会使用 Istio 测试 Bookinfo 应用的弹性,具体方式就是在 reviews:v2 和 ratings 之间进行延迟注入。接下来以测试用户的角度观察后续行为,我们会注意到 reviews 服务的 v2 版本有一个 Bug。注意所有其他用户都不会感知到正在进行的测试过程。
- 流量迁移,最后,会使用 Istio 将所有用户的流量转移到 reviews 的 v3 版本之中,以此来规避 v2 版本中 Bug 造成的影响。
上面的三个截图显示当在没有指定缺省路由时,将使用随机路由到该服务的所有可用版本上。基于内容的路由
实现所有请求都转发到每个服务对应的v1版本
创建虚拟服务
kubectl apply -f samples/bookinfo/networking/virtual-service-all-v1.yaml
因为这些配置是事件驱动,所以需等待几秒生效,可通过如下命令查看:
kubectl get virtualservices -o yaml
也可以通过如下命令查看subset定义:
kubectl get destinationrules -o yaml
效果为:多次访问http://$GATEWAY_URL/productpage都不显示星符号,说明是v1版本
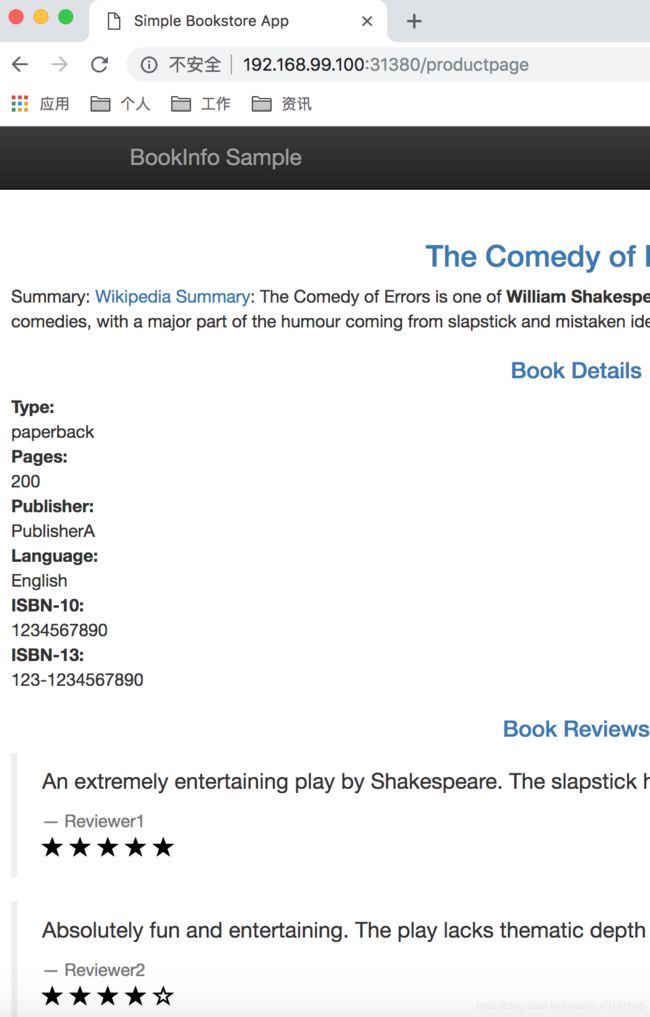
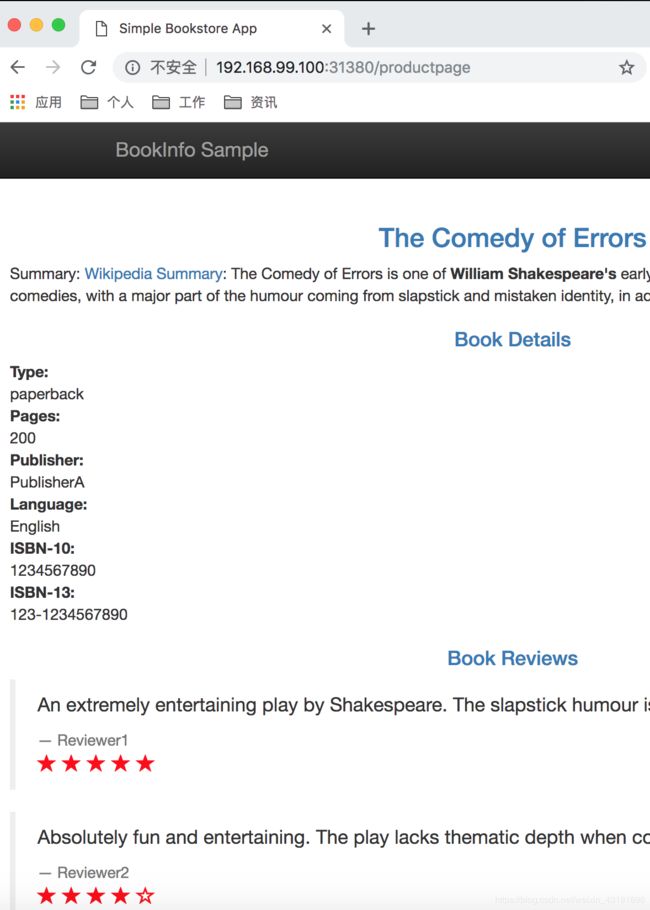
基于用户的路由
实现特定用户流量都转发到特定版本,如用户名为Jason的流量被路由到服务revews:v2,因为istio自身并不会识别用户身份,这个例子是建立在productpage服务向所有发给review服务的httprequest请求中添加一个自定义的“end-user"header头的基础上实现的。
通过下面命令创建基于用户的路由规则:
kubectl apply -f samples/bookinfo/networking/virtual-service-reviews-test-v2.yaml
确认规则是否被创建:
kubectl get virtualservice reviews -o yaml
访问测试,以Jason用户登录,下图符合预期。


背后原理:
在此任务中,您首先使用 Istio 将 100% 的请求流量都路由到了 Bookinfo 服务的 v1 版本。 然后再设置了一条路由规则,该路由规则在 productpage 服务中添加基于请求的 “end-user” 自定义 header 选择性地将特定的流量路由到了 reviews 服务的 v2 版本。
请注意,为了利用 Istio 的 L7 路由功能,Kubernetes 中的服务(如本任务中使用的 Bookinfo 服务)必须遵守如下限制:
- 需要给端口正确命名:服务端口必须进行命名。端口名称只允许是<协议>[-<后缀>-]模式,其中<协议>部分可选择范围包括 http、http2、grpc、mongo 以及 redis,Istio 可以通过对这些协议的支持来提供路由能力。例如 name: http2-foo 和 name: http 都是有效的端口名,但 name: http2foo 就是无效的。如果没有给端口进行命名,或者命名没有使用指定前缀,那么这一端口的流量就会被视为普通 TCP 流量(除非显式的用 Protocol: UDP 声明该端口是 UDP 端口)。
- 关联服务:Pod 必须关联到 Kubernetes 服务,如果一个 Pod 属于多个服务,这些服务不能再同一端口上使用不同协议,例如 HTTP 和 TCP。关联服务:Pod 必须关联到 Kubernetes 服务,如果一个 Pod 属于多个服务,这些服务不能再同一端口上使用不同协议,例如 HTTP 和 TCP。
- Deployment 应带有 app 以及 version 标签:在使用 Kubernetes Deployment 进行 Pod 部署的时候,建议显式的为 Deployment 加上 app 以及 version 标签。每个 Deployment 都应该有一个有意义的 app 标签和一个用于标识 Deployment 版本的 version 标签。app 标签在分布式跟踪的过程中会被用来加入上下文信息。Istio 还会用 app 和 version 标签来给遥测指标数据加入上下文信息。
示例-故障注入-HTTP延迟
我们将在reviews:v2和rating微服务之间用户“jason"调用加入7秒的延迟,由于reviews:v2服务对ratings服务的调用具有10秒的的硬编码延迟,因此我们期望端到端流程是正常的。创建规则来延迟来自用户jason的流量:
kubectl apply -f samples/bookinfo/networking/virtual-service-ratings-test-delay.yaml
kubectl get virtualservice ratings -o yaml
然后再次测试,退出登录访问页面 /productpage ,然后再以Jason登录发现6秒左右页面提示超时异常:

![]()
我们这个测试测出来一个bug:productpage调用review的超时时间是6秒(3秒超时+一次重试),但review调用rating的超时时间是硬编码的10秒,当我们注入7秒延迟后,将导致前端超时。
解决
demo中review-v3已经将对rating服务的硬编码缩小,我们需要做1把Jason用户的流量从v2切到v3,2把延迟入住缩小到2.8秒再试一下,需等待几秒钟,否则还不行。
kubectl edit virtualservice reviews
直接将spec.http.match.route中的v2改为v3保存即完成流量切换。
然后再修改延迟到2.8秒
kubectl edit virtualservice ratings
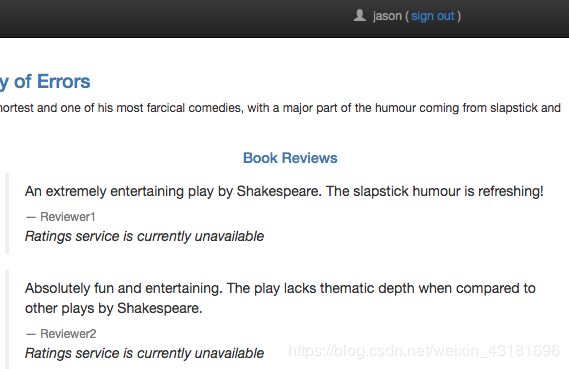
示例-故障注入-HTTP中断
给Jason用户的rating 请求作出中断
kubectl apply -f samples/bookinfo/networking/virtual-service-ratings-test-abort.yaml
kubectl get virtualservice ratings -o yaml
效果:

实例-流量转移
一个常见的用例是将流量从一个版本的微服务逐渐迁移到另一个版本,在istio中我们可以通过设置一组规则将部分百分比的流量分发到一个服务上,把另一部分分发打其他服务上,在这个例子中,我们将把50% 的流量分发到review:v1并且把50%的流量分发到review:v3,然后再把所有流量都分发到review:v3,基于权重的路由:
1,把所有流量分发到review-v1中:
kubectl apply -f samples/bookinfo/networking/virtual-service-all-v1.yaml
review-v1不显示星星,多次访问验证确实未显示
2,把review-v1的50%的流量发到review-v3
kubectl apply -f samples/bookinfo/networking/virtual-service-reviews-50-v3.yaml
通过查看详情:
spec:
  hosts:
  - reviews
  http:
  - route:
    - destination:
        host: reviews
        subset: v1
      weight: 50
    - destination:
        host: reviews
        subset: v3
      weight: 50
效果为:请求根据无星和红星分配,但测试效果显示并非严格的1:1,而是在一定范围内基本均衡。
3,当我们认为reivew-v3版本足够稳定后,把流量全部切到review-v3
kubectl apply -f samples/bookinfo/networking/virtual-service-reviews-v3.yaml
cat samples/bookinfo/networking/virtual-service-reviews-v3.yaml
apiVersion: networking.istio.io/v1alpha3
kind: VirtualService
metadata:
  name: reviews
spec:
  hosts:
    - reviews
  http:
  - route:
    - destination:
        host: reviews
        subset: v3
经访问验证全为v3的红星
示例-深入遥测
有4个任务:
- 收集指标:配置 Mixer,收集 Bookinfo 应用中所有服务的系列指标。
- 查询指标:安装 Prometheus 插件,用来收集指标,并在 Prometheus 服务中查询 Istio 指标。查询指标:安装 Prometheus 插件,用来收集指标,并在 Prometheus 服务中查询 Istio 指标。
- 分布式跟踪:这个任务会使用 Istio 来对应用中请求的流动路径进行跟踪。最终用户所体验的总体延迟在服务之间是如何分布的?分布式跟踪能够解决这一疑问,从而帮助开发人员更快的解决问题,这也是对分布式应用进行分析和排错的有力工具。
- 使用 Istio Dashboard:安装 Grafana 插件,这一插件中带有一个预配置 Dashboard,可以用来对服务网格中的流量进行监控。
收集指标和日志
首先确认Mixer是默认设置(其中:–configDefaultNamespace=istio-system)
然后新建一个yaml文件用来实现将istio接下来产生新的metric和日志流被自动收集,内容如下:
# 指标 instance 的配置
apiVersion: "config.istio.io/v1alpha2"
kind: metric
metadata:
  name: doublerequestcount
  namespace: istio-system
spec:
  value: "2" # 每个请求计数两次
  dimensions:
    source: source.service | "unknown"
    destination: destination.service | "unknown"
    message: '"twice the fun!"'
  monitored_resource_type: '"UNSPECIFIED"'
---
# prometheus handler 的配置
apiVersion: "config.istio.io/v1alpha2"
kind: prometheus
metadata:
  name: doublehandler
  namespace: istio-system
spec:
  metrics:
  - name: double_request_count # Prometheus 指标名称
    instance_name: doublerequestcount.metric.istio-system # Mixer Instance 名称(全限定名称)
    kind: COUNTER
    label_names:
    - source
    - destination
    - message
---
# 将指标 Instance 发送给 prometheus handler 的 rule 对象
apiVersion: "config.istio.io/v1alpha2"
kind: rule
metadata:
  name: doubleprom
  namespace: istio-system
spec:
  actions:
  - handler: doublehandler.prometheus
    instances:
    - doublerequestcount.metric
---
# logentry(日志条目)的 instance 配置
apiVersion: "config.istio.io/v1alpha2"
kind: logentry
metadata:
  name: newlog
  namespace: istio-system
spec:
  severity: '"warning"'
  timestamp: request.time
  variables:
    source: source.labels["app"] | source.service | "unknown"
    user: source.user | "unknown"
    destination: destination.labels["app"] | destination.service | "unknown"
    responseCode: response.code | 0
    responseSize: response.size | 0
    latency: response.duration | "0ms"
  monitored_resource_type: '"UNSPECIFIED"'
---
# stdio(标准输入输出)handler 的配置
apiVersion: "config.istio.io/v1alpha2"
kind: stdio
metadata:
  name: newhandler
  namespace: istio-system
spec:
 severity_levels:
   warning: 1 # Params.Level.WARNING
 outputAsJson: true
---
# 将 logentry instance 发送到 stdio 的 rule 对象配置
apiVersion: "config.istio.io/v1alpha2"
kind: rule
metadata:
  name: newlogstdio
  namespace: istio-system
spec:
  match: "true" # 匹配所有请求
  actions:
   - handler: newhandler.stdio
     instances:
     - newlog.logentry
---
然后使配置生效:
➜  istio-1.0.4 kubectl apply -f new_telemetry.yaml
metric "doublerequestcount" created
prometheus "doublehandler" created
rule "doubleprom" created
logentry "newlog" created
stdio "newhandler" created
rule "newlogstdio" created
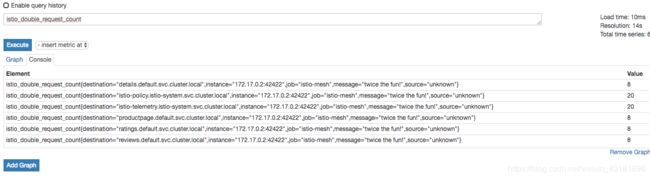
然后验证,发起访问,确保metric信息被导入到PrometheUS,先把PrometheUS对外可访问:
kubectl -n istio-system port-forward $(kubectl -n istio-system get pod -l app=prometheus -o jsonpath='{.items[0].metadata.name}') 9090:9090 &
接下来看日志是否追踪到了:
kubectl -n istio-system logs $(kubectl -n istio-system get pods -l istio-mixer-type=telemetry -o jsonpath='{.items[0].metadata.name}') -c mixer | grep \"instance\":\"newlog.logentry.istio-system\"
//-c是指定pod中具体的容器,因为有两个,一个是mixer 一个是istio-proxy
{"level":"warn","time":"2018-11-26T09:00:46.541292Z","instance":"newlog.logentry.istio-system","destination":"telemetry","latency":"2.245269ms","responseCode":200,"responseSize":5,"source":"reviews","user":"unknown"}
{"level":"warn","time":"2018-11-26T09:00:46.546469Z","instance":"newlog.logentry.istio-system","destination":"telemetry","latency":"2.751131ms","responseCode":200,"responseSize":5,"source":"productpage","user":"unknown"}
{"level":"warn","time":"2018-11-26T09:00:47.300427Z","instance":"newlog.logentry.istio-system","destination":"telemetry","latency":"2.537398ms","responseCode":200,"responseSize":5,"source":"reviews","user":"unknown"}
{"level":"warn","time":"2018-11-26T09:00:46.529868Z","instance":"newlog.logentry.istio-system","destination":"telemetry","latency":"11.352915ms","responseCode":200,"responseSize":5,"source":"policy","user":"unknown"}
{"level":"warn","time":"2018-11-26T09:00:46.546388Z","instance":"newlog.logentry.istio-system","destination":"telemetry","latency":"2.206884ms","responseCode":200,"responseSize":5,"source":"istio-ingressgateway","user":"unknown"}
解释前面的一段配置:
Kind:metric这段配置给名为doublerequestcount的新的metric定义了一个结构,这个实例配置告诉Mixer如何为任意请求生成metric值,指标来自于 Envoy 汇报的属性(然后由 Mixer 生成)。
对doublerequestcount.metric,它让Mixer为每个instance提供的值为2,因为istio为每个请求生成一个instance,这就意味着这个指标的记录的值等于收到请求数量的两倍。
每个 doublerequestcount.metric 都有一系列的 dimension。dimension 提供了一种为不同查询和需求对指标数据进行分割、聚合以及分析的方式。例如在对应用进行排错的过程中,可能只需要目标为某个服务的请求进行报告。这种配置让 Mixer 根据属性值和常量为 dimension 生成数值。例如 source 这个 dimension,他首先尝试从 source.service 属性中取值,如果取值失败,则会使用缺省值 “unknown”。而 message 这个 dimension,所有的 instance 都会得到一个常量值:“twice the fun!”。
kind: prometheus 这一段定义了一个叫做 doublehandler 的 handler。spec 中配置了 Prometheus 适配器收到指标之后,如何将指标 instance 转换为 Prometheus 能够处理的指标数据格式的方式。配置中生成了一个新的 Prometheus 指标,取名为 double_request_count。Prometheus 适配器会给指标名称加上 istio_ 前缀,因此这个指标在 Prometheus 中会显示为 istio_double_request_count。指标带有三个标签,和 doublerequestcount.metric 的 dimension 配置相匹配。
对于 kind: prometheus 来说,Mixer 中的 instance 通过 instance_name 来匹配 Prometheus 指标。instance_name 必须是一个全限定名称(例如:doublerequestcount.metric.istio-system)
kind: rule 部分定义了一个新的叫做 doubleprom 的 rule 对象。这个对象要求 Mixer 把所有的 doublerequestcount.metric 发送给 doublehandler.prometheus。因为 rule 中没有包含 match 字段,并且身处缺省配置的命名空间内(istio-system),所以这个 rule 对象对所有的网格内通信都会生效。
理解日志配置:
日志配置要求Mixer把日志发送给stdout,它使用了三个部分的配置:instance配置,handler配置自己rule配置。
配置中的kind:logentry一节定义了生成日志条目(命名为newlog的instance)的格式,这个instance配置告知Mixer如何根据请求过程中Envoy报告的属性生成日志条目。
severity 参数用来指定生成的logentry的日志级别,在本例中使用的是一个常亮“warning“,这个值会被映射到支持日志级别数据的logentry handler中。
timestamp参数为所有日志条目提供了时间信息,在本例中,时间从Envoy提供的request.time中获取。
variables 参数让运维人员可以配置每个logentry中应包含什么数据,一系列的表达式控制了从Istio属性以及常量映射和组成logentry的过程,在本文中,每个logentry都有一个latency字段,这个字段是从response.duration属性中得来的,如果response.duration中没有值,latency字段就会设置为0ms。
kind: stdio这段配置定义了一个叫做newhandler的handler。Handler的spec配置了stdio适配器收到logentry instance之后的处理方法。severity_levels参数控制了logentry中severity字段的映射方式。这里的常量“warning”映射为WARNING日志级别。outputAsJson参数要求适配器生成json格式的日志。
kind: rule 部分定义了命名为 newlogstdio 的 rule 对象。这个对象引导 Mixer 把所有 newlog.logentry instance 发送给 newhandler.stdio handler。因为 match 参数取值为 true,所以网格中所有的请求都会执行这一对象。
match: true 表达式的含义是,这一对象的执行无需过滤,对所有请求都会生效。在 spec 中省略 match 参数和设置 match: true 是等效的。这里的显示声明,目的是展示在 rule 控制过程中 match 表达式的使用方法。
使用Grafana
检查PrometheUS和granfa是否已经在运行:
➜  istio-1.0.4 kubectl -n istio-system get svc prometheus
NAME         TYPE        CLUSTER-IP      EXTERNAL-IP   PORT(S)    AGE
prometheus   ClusterIP   10.103.242.95           9090/TCP   3d
➜  istio-1.0.4 kubectl -n istio-system get svc grafana
NAME      TYPE        CLUSTER-IP       EXTERNAL-IP   PORT(S)    AGE
grafana   ClusterIP   10.110.143.147           3000/TCP   3d
➜  istio-1.0.4
通过grafana ui打开istio dashboard
kubectl -n istio-system port-forward $(kubectl -n istio-system get pod -l app=grafana -o jsonpath='{.items[0].metadata.name}') 3000:3000 &
然后访问:http://localhost:3000/dashboard/db/istio-mesh-dashboard
访问http://$GATEWAY_URL/productpage几次后再刷新页面发现有数据产生:

killall kubectl关闭所有正在运行的port-forward进程。
生成服务图
kubectl -n istio-system port-forward $(kubectl -n istio-system get pod -l app=servicegraph -o jsonpath='{.items[0].metadata.name}') 8088:8088 &
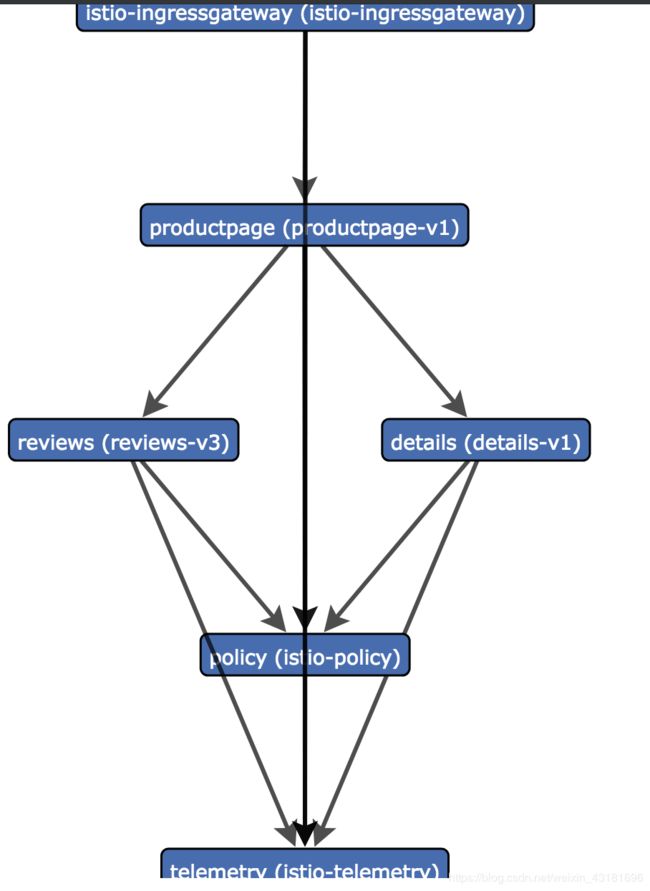
Servicegraph 服务提供端点,用于生成和可视化网格内的服务图, 它公开了以下端点:
- /force/forcegraph.html 如上所述,这是一个交互式D3.js 可视化。
- /dotviz 是一个静态的Graphviz 可视化。
- /dotgraph 提供DOT序列化。
- /d3graph 为 D3 可视化提供了 JSON 序列化。
- /graph 提供通用的 JSON 序列化。
所有端点都采用上面探讨的查询参数。
Servicegraph 示例建立在 Prometheus 查询之上,取决于标准的 Istio 度量标准配置。
EFK日志收集
新建一个efk集群(最基础版)将以下内容放在logging-stack.yaml,执行创建:
kubectl apply -f logging-stack.yaml
# Logging 命名空间。下面的资源都是这个命名空间的一部分。
apiVersion: v1
kind: Namespace
metadata:
  name: logging
---
# Elasticsearch Service
apiVersion: v1
kind: Service
metadata:
  name: elasticsearch
  namespace: logging
  labels:
    app: elasticsearch
spec:
  ports:
  - port: 9200
    protocol: TCP
    targetPort: db
  selector:
    app: elasticsearch
---
# Elasticsearch Deployment
apiVersion: extensions/v1beta1
kind: Deployment
metadata:
  name: elasticsearch
  namespace: logging
  labels:
    app: elasticsearch
  annotations:
    sidecar.istio.io/inject: "false"
spec:
  template:
    metadata:
      labels:
        app: elasticsearch
    spec:
      containers:
      - image: docker.elastic.co/elasticsearch/elasticsearch-oss:6.1.1
        name: elasticsearch
        resources:
          # need more cpu upon initialization, therefore burstable class
          limits:
            cpu: 1000m
          requests:
            cpu: 100m
        env:
          - name: discovery.type
            value: single-node
        ports:
        - containerPort: 9200
          name: db
          protocol: TCP
        - containerPort: 9300
          name: transport
          protocol: TCP
        volumeMounts:
        - name: elasticsearch
          mountPath: /data
      volumes:
      - name: elasticsearch
        emptyDir: {}
---
# Fluentd Service
apiVersion: v1
kind: Service
metadata:
  name: fluentd-es
  namespace: logging
  labels:
    app: fluentd-es
spec:
  ports:
  - name: fluentd-tcp
    port: 24224
    protocol: TCP
    targetPort: 24224
  - name: fluentd-udp
    port: 24224
    protocol: UDP
    targetPort: 24224
  selector:
    app: fluentd-es
---
# Fluentd Deployment
apiVersion: extensions/v1beta1
kind: Deployment
metadata:
  name: fluentd-es
  namespace: logging
  labels:
    app: fluentd-es
  annotations:
    sidecar.istio.io/inject: "false"
spec:
  template:
    metadata:
      labels:
        app: fluentd-es
    spec:
      containers:
      - name: fluentd-es
        image: gcr.io/google-containers/fluentd-elasticsearch:v2.0.1
        env:
        - name: FLUENTD_ARGS
          value: --no-supervisor -q
        resources:
          limits:
            memory: 500Mi
          requests:
            cpu: 100m
            memory: 200Mi
        volumeMounts:
        - name: config-volume
          mountPath: /etc/fluent/config.d
      terminationGracePeriodSeconds: 30
      volumes:
      - name: config-volume
        configMap:
          name: fluentd-es-config
---
# Fluentd ConfigMap, 包含了配置文件。
kind: ConfigMap
apiVersion: v1
data:
  forward.input.conf: |-
    # Takes the messages sent over TCP

      type forward

  output.conf: |-

       type elasticsearch
       log_level info
       include_tag_key true
       host elasticsearch
       port 9200
       logstash_format true
       # Set the chunk limits.
       buffer_chunk_limit 2M
       buffer_queue_limit 8
       flush_interval 5s
       # Never wait longer than 5 minutes between retries.
       max_retry_wait 30
       # Disable the limit on the number of retries (retry forever).
       disable_retry_limit
       # Use multiple threads for processing.
       num_threads 2

metadata:
  name: fluentd-es-config
  namespace: logging
---
# Kibana Service
apiVersion: v1
kind: Service
metadata:
  name: kibana
  namespace: logging
  labels:
    app: kibana
spec:
  ports:
  - port: 5601
    protocol: TCP
    targetPort: ui
  selector:
    app: kibana
---
# Kibana Deployment
apiVersion: extensions/v1beta1
kind: Deployment
metadata:
  name: kibana
  namespace: logging
  labels:
    app: kibana
  annotations:
    sidecar.istio.io/inject: "false"
spec:
  template:
    metadata:
      labels:
        app: kibana
    spec:
      containers:
      - name: kibana
        image: docker.elastic.co/kibana/kibana-oss:6.1.1
        resources:
          # need more cpu upon initialization, therefore burstable class
          limits:
            cpu: 1000m
          requests:
            cpu: 100m
        env:
          - name: ELASTICSEARCH_URL
            value: http://elasticsearch:9200
        ports:
        - containerPort: 5601
          name: ui
          protocol: TCP
---
现在有一个运行中的Fluentd进程,给istio配置一个新的日志类型,然后发送这些日志到监听的fluentd进程,通过创建如下配置文件并应用,即可让istio实现日志自动生成和收集。
# Configuration for logentry instances
apiVersion: "config.istio.io/v1alpha2"
kind: logentry
metadata:
  name: newlog
  namespace: istio-system
spec:
  severity: '"info"'
  timestamp: request.time
  variables:
    source: source.labels["app"] | source.workload.name | "unknown"
    user: source.user | "unknown"
    destination: destination.labels["app"] | destination.workload.name | "unknown"
    responseCode: response.code | 0
    responseSize: response.size | 0
    latency: response.duration | "0ms"
  monitored_resource_type: '"UNSPECIFIED"'
---
# Configuration for a fluentd handler
apiVersion: "config.istio.io/v1alpha2"
kind: fluentd
metadata:
  name: handler
  namespace: istio-system
spec:
  address: "fluentd-es.logging:24224"
---
# Rule to send logentry instances to the fluentd handler
apiVersion: "config.istio.io/v1alpha2"
kind: rule
metadata:
  name: newlogtofluentd
  namespace: istio-system
spec:
  match: "true" # match for all requests
  actions:
   - handler: handler.fluentd
     instances:
     - newlog.logentry
---
kubectl apply -f fluentd-istio.yaml
然后访问下页面以生成日志
curl http://$GATEWAY_URL/productpage
然后查看日志
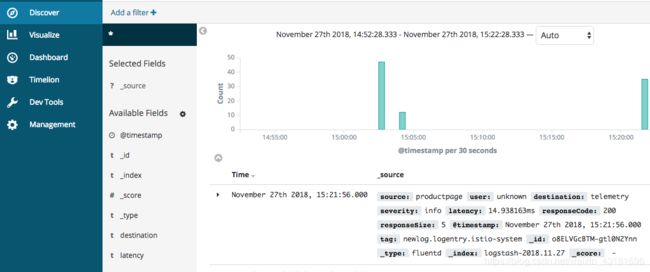
kubectl -n logging port-forward $(kubectl -n logging get pod -l app=kibana -o jsonpath='{.items[0].metadata.name}') 5601:5601 &
打开本地kibana设置索引后进行日志查看:
参考
https://istio.io/zh/docs
https://istio.io/docs
https://juejin.im/post/5b461362e51d45190d551be5
http://www.roadjava.com/s/spsb/hadoop/2018/08/istiobnzdzrsidecardjjff.html