机器学习(回归十)——阶段性总结
现在对回归做一下阶段性总结。回归算法,总的来说就是这些,当然还有一些变种,基本上逃不过线性回归和逻辑回归这两种。其实回归家族中还有比较有名的树回归,这里就先不介绍,因为会涉及决策树相关的内容,所以后面讲到决策树时再做介绍。(其实内容特别简单)
总结
先做一下总结:
- 线性模型一般用于回归问题,Logistic和Softmax模型一般用于分类问题
- 求θ的主要方式是梯度下降算法,梯度下降算法是参数优化的重要手段,主要是SGD,适用于在线学习以及跳出局部极小值
- Logistic/Softmax回归是实践中解决分类问题的最重要的方法(逻辑回归和softmax,是实际工作中是解决性比较强的算法,计算的就是相关的概率,其他的(决策输出)基本没有这俩解释性强,比如SVM。实际工作中如果要求解释性比较强的分类算法,就可以用这两种或决策树。)
- 广义线性模型对样本要求不必要服从正态分布、只需要服从指数分布簇(二项分布、泊松分布、伯努利分布、指数分布等)即可;广义线性模型的自变量可以是连续的也可以是离散的。
- 在此期间介绍机器学习中主要用到的一种求解方法就是梯度下降。
再串一下前面几篇博客的内容:
首先是对线性回归的理解,简单来说就是找到这样一条直线去拟合数据,求解时,最便捷的是最小二乘,也就是平方和损失函数,求解过程,就是对θ的解析。
解析的过程发现数据不是线性的,可进行多项式扩展,然后再用线性回归,这样就可比较好的拟合了。多项式扩展会存在过拟合的问题,可以采用L1和L2正则。
不管是普通的线性回归还是L1或L2 正则,在求解时,最常用的是梯度下降。只要是函数是可以求导的,就能用梯度下降,哪怕不是全局凸函数也没事,可以采用SGD,来跳过局部最优,而达到全局最优。当然机器学习领域遇到的基本都是凸函数。
最后面就是逻辑回归和softmax,逻辑回归是二分类,softmax是多分类。可以说他俩都是基于回归的思想来解决分类的问题。
在此还举了一些例子,进行了代码实现,对机器学习的流程有个直观的理解:数据的读取、处理、分割,特征工程,接下来是模型的构建,模型效果的验证,如果有超参,还有超参的选定,最后还有模型的持久化。
代码案例
不写个代码,总感觉缺点什么。下面就基于信贷数据进行用户信贷分类,使用Logistic算法和KNN算法构建模型,并比较这两大类算法的效果。(虽然KNN还没介绍了,不过后续博客会对KNN进行详细的介绍,这里只是简单的用了一下)
数据
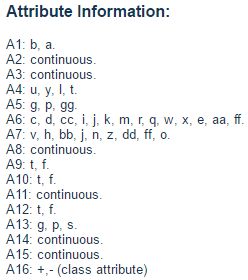
数据的来源: Credit Approval Data Set
翻译过来,大致内容:
还是算了,着实不好翻译……
代码
import numpy as np
import matplotlib as mpl
import matplotlib.pyplot as plt
import pandas as pd
import warnings
# 上面是机器学习库,numpy之类的,下面是sklearn的
import sklearn
from sklearn.linear_model import LogisticRegressionCV
from sklearn.linear_model.coordinate_descent import ConvergenceWarning
from sklearn.model_selection import train_test_split
from sklearn.preprocessing import StandardScaler
from sklearn.pipeline import Pipeline #管道
from sklearn.neighbors import KNeighborsClassifier

## 设置字符集,防止中文乱码
mpl.rcParams['font.sans-serif']=[u'simHei']
mpl.rcParams['axes.unicode_minus']=False
## 拦截异常
warnings.filterwarnings(action = 'ignore', category=ConvergenceWarning)

help(pd.read_csv)
要读取数据,先看一下这个函数
read_csv(filepath_or_buffer, sep=’,’, delimiter=None, header=‘infer’, names=None, index_col=None, usecols=None, squeeze=False, prefix=None, mangle_dupe_cols=True, dtype=None, engine=None, converters=None, true_values=None, false_values=None, skipinitialspace=False, skiprows=None, nrows=None, na_values=None, keep_default_na=True, na_filter=True, verbose=False, skip_blank_lines=True, parse_dates=False, infer_datetime_format=False, keep_date_col=False, date_parser=None, dayfirst=False, iterator=False, chunksize=None, compression=‘infer’, thousands=None, decimal=b’.’, lineterminator=None, quotechar=’"’, quoting=0, escapechar=None, comment=None, encoding=None, dialect=None, tupleize_cols=None, error_bad_lines=True, warn_bad_lines=True, skipfooter=0, doublequote=True, delim_whitespace=False, low_memory=True, memory_map=False, float_precision=None)
- filepath_or_buffer:文件路径或内存中的数据
- sep:分隔符
- header:头部,默认是‘infer’,表示第一条
- names:有头部,列名就自动给
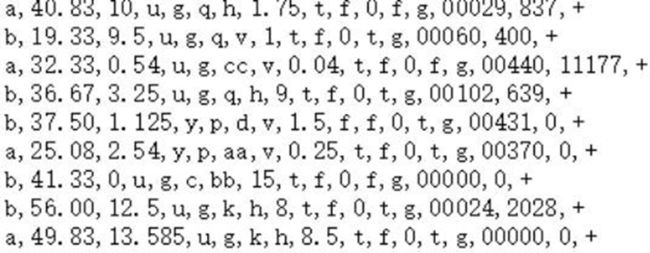
我们可以读数据看一下。
pd.read_csv("datas/crx.data", header=None)
此时有了列号:

但是发现行列都是数字,所以可以加一下默认命名:
### 加载数据并对数据进行预处理
# 1. 加载数据
path = "datas/crx.data"
names = ['A1','A2','A3','A4','A5','A6','A7','A8',
         'A9','A10','A11','A12','A13','A14','A15','A16']
df = pd.read_csv(path, header=None, names=names)
print ("数据条数:", len(df))

# 2. 异常数据过滤
df = df.replace("?", np.nan).dropna(how='any')
print ("过滤后数据条数:", len(df))

df.head(5)
数据条数: 690
过滤后数据条数: 653

接下来看一下数据类型(必须是数值形,才支持,),以及是否有空值
df.info() # 看一下各个列的字符相关信息
Int64Index: 653 entries, 0 to 689
Data columns (total 16 columns):
A1 653 non-null object
A2 653 non-null object
A3 653 non-null float64
A4 653 non-null object
A5 653 non-null object
A6 653 non-null object
A7 653 non-null object
A8 653 non-null float64
A9 653 non-null object
A10 653 non-null object
A11 653 non-null int64
A12 653 non-null object
A13 653 non-null object
A14 653 non-null object
A15 653 non-null int64
A16 653 non-null object
dtypes: float64(2), int64(2), object(12)
memory usage: 86.7+ KB
# TODO: 有没有其它便捷的代码一次性查看所有的数据类型为object的取值信息
df.A16.value_counts()
- 357
+ 296
Name: A16, dtype: int64
正表示审批通过,负表示不通过
这里的数据处理是自己写的,实际是有相关的API的
# 自定义的一个哑编码实现方式:将v变量转换成为一个向量/list集合的形式
def parse(v, l):
    # v是一个字符串,需要进行转换的数据
    # l是一个类别信息,其中v是其中的一个值
    return [1 if i == v else 0 for i in l]
# 定义一个处理每条数据的函数
def parseRecord(record):
    result = []
    ## 格式化数据,将离散数据转换为连续数据
    a1 = record['A1']
    for i in parse(a1, ('a', 'b')):
        result.append(i)

    result.append(float(record['A2']))
    result.append(float(record['A3']))

    # 将A4的信息转换为哑编码的形式; 对于DataFrame中,原来一列的数据现在需要四列来进行表示
    a4 = record['A4']
    for i in parse(a4, ('u', 'y', 'l', 't')):
        result.append(i)

    a5 = record['A5']
    for i in parse(a5, ('g', 'p', 'gg')):
        result.append(i)

    a6 = record['A6']
    for i in parse(a6, ('c', 'd', 'cc', 'i', 'j', 'k', 'm', 'r', 'q', 'w', 'x', 'e', 'aa', 'ff')):
        result.append(i)

    a7 = record['A7']
    for i in parse(a7, ('v', 'h', 'bb', 'j', 'n', 'z', 'dd', 'ff', 'o')):
        result.append(i)

    result.append(float(record['A8']))

    a9 = record['A9']
    for i in parse(a9, ('t', 'f')):
        result.append(i)

    a10 = record['A10']
    for i in parse(a10, ('t', 'f')):
        result.append(i)

    result.append(float(record['A11']))

    a12 = record['A12']
    for i in parse(a12, ('t', 'f')):
        result.append(i)

    a13 = record['A13']
    for i in parse(a13, ('g', 'p', 's')):
        result.append(i)

    result.append(float(record['A14']))
    result.append(float(record['A15']))

    a16 = record['A16']
    if a16 == '+':
        result.append(1)
    else:
        result.append(0)

    return result
# 哑编码实验
print(parse('v', ['v', 'y', 'l']))
print(parse('y', ['v', 'y', 'l']))
print(parse('l', ['v', 'y', 'l']))
[1, 0, 0]
[0, 1, 0]
[0, 0, 1]
### 数据特征处理(将数据转换为数值类型的)
new_names =  ['A1_0', 'A1_1',
              'A2','A3',
              'A4_0','A4_1','A4_2','A4_3', # 因为需要对A4进行哑编码操作,需要使用四列来表示一列的值
              'A5_0', 'A5_1', 'A5_2',
              'A6_0', 'A6_1', 'A6_2', 'A6_3', 'A6_4', 'A6_5', 'A6_6', 'A6_7', 'A6_8', 'A6_9', 'A6_10', 'A6_11', 'A6_12', 'A6_13',
              'A7_0', 'A7_1', 'A7_2', 'A7_3', 'A7_4', 'A7_5', 'A7_6', 'A7_7', 'A7_8',
              'A8',
              'A9_0', 'A9_1' ,
              'A10_0', 'A10_1',
              'A11',
              'A12_0', 'A12_1',
              'A13_0', 'A13_1', 'A13_2',
              'A14','A15','A16']
datas = df.apply(lambda x: pd.Series(parseRecord(x), index = new_names), axis=1)
names = new_names

## 展示一下处理后的数据
datas.head(5)
datas.info()
Int64Index: 653 entries, 0 to 689
Data columns (total 48 columns):
A1_0 653 non-null float64
A1_1 653 non-null float64
A2 653 non-null float64
A3 653 non-null float64
A4_0 653 non-null float64
A4_1 653 non-null float64
A4_2 653 non-null float64
A4_3 653 non-null float64
A5_0 653 non-null float64
A5_1 653 non-null float64
A5_2 653 non-null float64
A6_0 653 non-null float64
A6_1 653 non-null float64
A6_2 653 non-null float64
A6_3 653 non-null float64
A6_4 653 non-null float64
A6_5 653 non-null float64
A6_6 653 non-null float64
A6_7 653 non-null float64
A6_8 653 non-null float64
A6_9 653 non-null float64
A6_10 653 non-null float64
A6_11 653 non-null float64
A6_12 653 non-null float64
A6_13 653 non-null float64
A7_0 653 non-null float64
A7_1 653 non-null float64
A7_2 653 non-null float64
A7_3 653 non-null float64
A7_4 653 non-null float64
A7_5 653 non-null float64
A7_6 653 non-null float64
A7_7 653 non-null float64
A7_8 653 non-null float64
A8 653 non-null float64
A9_0 653 non-null float64
A9_1 653 non-null float64
A10_0 653 non-null float64
A10_1 653 non-null float64
A11 653 non-null float64
A12_0 653 non-null float64
A12_1 653 non-null float64
A13_0 653 non-null float64
A13_1 653 non-null float64
A13_2 653 non-null float64
A14 653 non-null float64
A15 653 non-null float64
A16 653 non-null float64
dtypes: float64(48)
memory usage: 250.0 KB
## 数据分割
X = datas[names[0:-1]]
Y = datas[names[-1]]

X_train,X_test,Y_train,Y_test = train_test_split(X,Y,test_size=0.1,random_state=0)

X_train.describe().T
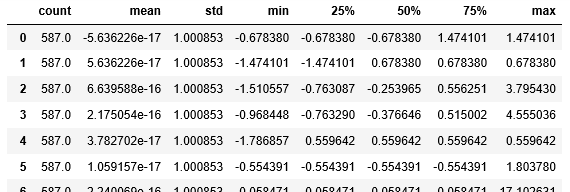
## 数据正则化操作(归一化)
ss = StandardScaler()
## 模型训练一定是在训练集合上训练的
X_train = ss.fit_transform(X_train) ## 训练正则化模型,并将训练数据归一化操作
X_test = ss.transform(X_test) ## 使用训练好的模型对测试数据进行归一化操作

pd.DataFrame(X_train).describe().T
## Logistic算法模型构建
# LogisticRegression中,参数说明:
# penalty => 惩罚项方式,即使用何种方式进行正则化操作(可选: l1或者l2)
# C => 惩罚项系数,即L1或者L2正则化项中给定的那个λ系数(ppt上)
# LogisticRegressionCV中,参数说明:
# LogisticRegressionCV表示LogisticRegression进行交叉验证选择超参数(惩罚项系数C/λ)
# Cs => 表示惩罚项系数的可选范围
lr = LogisticRegressionCV(Cs=np.logspace(-4,1,50), fit_intercept=True, penalty='l2', solver='lbfgs', tol=0.01, multi_class='ovr')
lr.fit(X_train, Y_train)
solver:‘lbfgs’拟牛顿法
逻辑回归在真正的二分类中,效果还是可以的,但它不适合多分类,虽然softmax可以做,但实际应用中,对于多分类很少用softmax。但有两点需要注意:
- softmax和其他多分类的求解方式很不一样。其他多分类要构建很多个模型,而softmax只构建一个。
- softmax属于各类别的概率都算出来,以最大的为标准,和深度学习最一个隐层的功能非常类似。所以深度学习最后一层是softmax
# Logistic算法效果输出
lr_r = lr.score(X_train, Y_train)
print ("Logistic算法R值(训练集上的准确率):", lr_r)
print ("Logistic算法稀疏化特征比率:%.2f%%" % (np.mean(lr.coef_.ravel() == 0) * 100))
print ("Logistic算法参数:",lr.coef_)
print ("Logistic算法截距:",lr.intercept_)
Logistic算法R值(训练集上的准确率): 0.8909710391822828
Logistic算法稀疏化特征比率:2.13%
Logistic算法参数: [[-0.00507672 0.00507672 0.06367298 0.06284643 0.03997945 -0.04935683
0.06679464 0. 0.03997945 -0.04935683 0.06679464 0.00549457
-0.02646873 0.1057865 -0.10294239 -0.02346199 -0.05981958 -0.0131902
0.01148842 0.04690591 0.03631018 0.13996153 0.03858644 -0.02422956
-0.11817039 -0.00441403 0.08130739 -0.02489682 0.03130081 0.03567533
-0.01396069 -0.00769375 -0.10417126 -0.00379776 0.15834772 0.46892613
-0.46892613 0.16546747 -0.16546747 0.19117654 -0.01273762 0.01273762
0.01240825 -0.00744574 -0.0110668 -0.08907636 0.12989149]]
Logistic算法截距: [-0.25992008]
## Logistic算法预测(预测所属类别)
lr_y_predict = lr.predict(X_test)
lr_y_predict
array([1., 1., 1., 0., 1., 1., 0., 1., 0., 1., 1., 0., 0., 1., 1., 0., 1.,
0., 0., 1., 0., 0., 0., 0., 0., 0., 0., 1., 1., 0., 0., 1., 0., 0.,
1., 0., 0., 0., 0., 0., 1., 1., 0., 0., 0., 0., 1., 0., 0., 1., 1.,
0., 1., 0., 0., 1., 0., 1., 1., 1., 0., 1., 0., 1., 0., 1.])
## Logistic算法获取概率值(就是Logistic算法计算出来的结果值)
y1 = lr.predict_proba(X_test)
y1
array([[0.22855228, 0.77144772],
[0.18260146, 0.81739854],
[0.15724948, 0.84275052],
[0.8701438 , 0.1298562 ],
[0.47949865, 0.52050135],
[0.05541409, 0.94458591],
[0.75895994, 0.24104006],
[0.21888948, 0.78111052],
[0.88715054, 0.11284946],
…
[0.87790067, 0.12209933],
[0.44764238, 0.55235762],
[0.86480515, 0.13519485],
[0.11153426, 0.88846574],
[0.82395841, 0.17604159],
[0.44200894, 0.55799106]])
## KNN算法构建
knn = KNeighborsClassifier(n_neighbors=20, algorithm='kd_tree', weights='distance')
knn.fit(X_train, Y_train)
KNeighborsClassifier(algorithm=‘kd_tree’, leaf_size=30, metric=‘minkowski’,
metric_params=None, n_jobs=1, n_neighbors=20, p=2,
weights=‘distance’)
## KNN算法效果输出
knn_r = knn.score(X_train, Y_train)
print("Logistic算法训练上R值(准确率):%.2f" % knn_r)
Logistic算法训练上R值(准确率):1.00
## KNN算法预测
knn_y_predict = knn.predict(X_test)
knn_r_test = knn.score(X_test, Y_test)
print("Logistic算法训练上R值(测试集上准确率):%.2f" % knn_r_test)
Logistic算法训练上R值(测试集上准确率):0.83
## 结果图像展示
## c. 图表展示
x_len = range(len(X_test))
plt.figure(figsize=(14,7), facecolor='w')
plt.ylim(-0.1,1.1)
plt.plot(x_len, Y_test, 'ro',markersize = 6, zorder=3, label=u'真实值')
plt.plot(x_len, lr_y_predict, 'go', markersize = 10, zorder=2, label=u'Logis算法预测值,$R^2$=%.3f' % lr.score(X_test, Y_test))
plt.plot(x_len, knn_y_predict, 'yo', markersize = 16, zorder=1, label=u'KNN算法预测值,$R^2$=%.3f' % knn.score(X_test, Y_test))
plt.legend(loc = 'center right')
plt.xlabel(u'数据编号', fontsize=18)
plt.ylabel(u'是否审批(0表示通过,1表示通过)', fontsize=18)
plt.title(u'Logistic回归算法和KNN算法对数据进行分类比较', fontsize=20)
plt.show()
最终: Logistic回归算法比KNN算法的结果好一些。


