决策边界绘制和plt.contourf函数讲解
先讲解plt.contourf函数,然后用plt.contourf绘制决策边界
contourf
contourf(*args, data=None, **kwargs)
Plot contours.
Call signature::

    contour([X, Y,] Z, [levels], **kwargs)

`.contour` and `.contourf` draw contour lines and filled contours,
respectively.  Except as noted, function signatures and return values
are the same for both versions.

Parameters
----------
X, Y : array-like, optional
    The coordinates of the values in Z .

    X and Y must both be 2-D with the same shape as Z (e.g.
    created via `numpy.meshgrid`), or they must both be 1-D such
    that ``len(X) == M`` is the number of columns in Z and
    ``len(Y) == N`` is the number of rows in Z.

    If not given, they are assumed to be integer indices, i.e.
    ``X = range(M)``, ``Y = range(N)``.

Z : array-like(N, M)
    The height values over which the contour is drawn.

levels : int or array-like, optional
    Determines the number and positions of the contour lines / regions.

    If an int n, use n data intervals; i.e. draw n+1 contour
    lines. The level heights are automatically chosen.

    If array-like, draw contour lines at the specified levels.
    The values must be in increasing order.
这个是官方文档中,关于contour的说明,在这我就不全部翻译,我把我们常用的东西翻译出来。
参数X,Y
文档中说
array-like, optional
The coordinates of the values in Z .
第一句的意思是,这2个数组的维度应该是一样的,并且这个参数是可选的,你可以不输入这个东西
第二句的意思是,X,Y是Z的坐标值
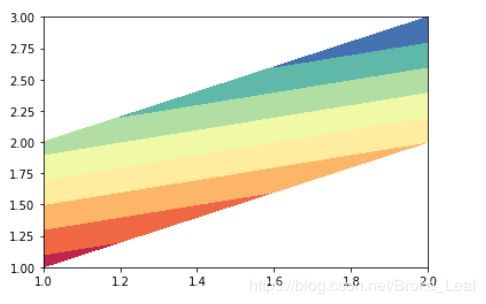
测试一下contour:
import matplotlib.pyplot as plt
import numpy as np
x=np.array([[1,2],[1,2]])
y=np.array([[1,2],[2,3]])
z=np.array([[1,2],[3,4]])
#plt.cm.Spectral,在这的意思就是颜色会随Z的值变化
plt.contourf(x, y, z, cmap=plt.cm.Spectral)
Z在百度翻译中翻译为:绘制轮廓的高度值。
这个翻译有点问题,Z一个是等高线的高度值,但是我不是学地理的。。。。所以我也不太懂这个等高线有个什么意义。我只能说明一下Z的坐标问题。
x和y是z的坐标
x=np.array([[1,2],[1,2]])
y=np.array([[1,2],[2,3]])
z=np.array([[1,2],[3,4]])
我们把这些排列好,方便观察
第1个坐标(1,1)
第2个坐标(2,2)
第3个坐标(1,2)
第4个坐标(2,3)
Z在图中对应这4个点。
如果你知道这个颜色怎么来的可以留言告诉我。
下面进行决策边界的绘画,其实当X,Y的数量较多的时候,Z的分布显得比较有规律。
绘制决策边界
我们先看看当X,Y密集点时候的效果
import matplotlib.pyplot as plt
import numpy as np
X,Y=np.meshgrid(np.linspace(1,5,200),np.linspace(1,5,200))
Z=np.zeros(shape=(X.shape))
Z=Z.ravel()
Z[:10000]=1
Z[10000:20000]=2
Z[20000:30000]=3
Z=Z.reshape(X.shape)
plt.contourf(X,Y,Z,cmp=plt.cm.Spectral)
显然,X,Y密集时,Z的分布的规律更好看到
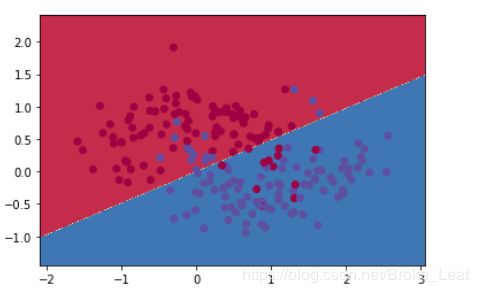
决策边界代码:
import numpy as np
from sklearn.linear_model import LogisticRegressionCV
from sklearn.datasets import make_moons

def plot_decision_boundary(X,y):
    clf=LogisticRegressionCV()
    clf.fit(X,y)
    x_min, x_max = X[:, 0].min() - .5, X[:, 0].max() + .5
    y_min, y_max = X[:, 1].min() - .5, X[:, 1].max() + .5
    h=0.01

    xx,yy=np.meshgrid(np.arange(x_min,x_max,h),np.arange(y_min,y_max,h))
    z=clf.predict(np.c_[xx.ravel(),yy.ravel()])
    z=z.reshape(xx.shape)

    plt.contourf(xx, yy, z, cmap=plt.cm.Spectral)
    plt.scatter(X[:, 0], X[:, 1], c=y, cmap=plt.cm.Spectral)
X,y=make_moons(n_samples=200,noise=0.3)
plot_decision_boundary(X,y)

