python之scipy库详解
Scipy是一个用于数学、科学、工程领域的常用软件包,可以处理插值、积分、优化、图像处理、常微分方程数值解的求解、信号处理等问题。它用于有效计算Numpy矩阵,使Numpy和Scipy协同工作,高效解决问题。
Scipy 由不同科学计算领域的子模块组成:
| 子模块 | 描述 |
|---|---|
cluster |
聚类算法 |
constants |
物理数学常数 |
fftpack |
快速傅里叶变换 |
integrate |
积分和常微分方程求解 |
interpolate |
插值 |
io |
输入输出 |
linalg |
线性代数 |
odr |
正交距离回归 |
optimize |
优化和求根 |
signal |
信号处理 |
sparse |
稀疏矩阵 |
spatial |
空间数据结构和算法 |
special |
特殊方程 |
stats |
统计分布和函数 |
weave |
C/C++ 积分 |
在使用 Scipy 之前,为了方便,假定这些基础的模块已经被导入:
import numpy as np
import scipy as sp
import matplotlib as mpl
import matplotlib.pyplot as plt
由于 Scipy 以 Numpy 为基础,因此很多基础的 Numpy 函数可以在scipy 命名空间中直接调用
1.插值
样条插值法是一种以可变样条来作出一条经过一系列点的光滑曲线的数学方法
from scipy.interpolate import interp1d
np.set_printoptions(precision=2, suppress=True) #设置 Numpy 浮点数显示格式
#从文本中读入数据
data = np.genfromtxt("JANAF_CH4.txt",
                  delimiter="\t", # TAB 分隔
                  skiprows=1,     # 忽略首行
                  names=True,     # 读入属性
                  missing_values="INFINITE",  # 缺失值
                  filling_values=np.inf)      # 填充缺失值
ch4_cp = interp1d(data['TK'], data['Cp'])  #默认情况下,输入值要在插值允许的范围内,否则插值会报错
我们可以通过 kind 参数来调节使用的插值方法,来得到不同的结果:
nearest最近邻插值zero0阶插值linear线性插值quadratic二次插值cubic三次插值4,5,6,7更高阶插值
对于径向基函数,其插值的公式为:
![]()
通过数据点 xj来计算出 nj 的值,来计算 x处的插值结果
from scipy.interpolate.rbf import Rbf
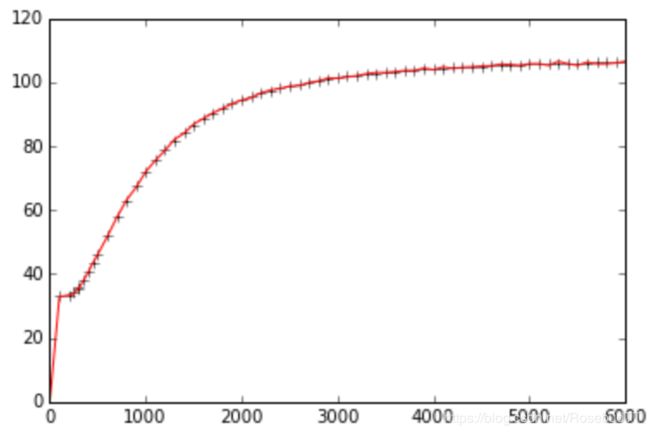
cp_rbf = Rbf(data['TK'], data['Cp'], function = "multiquadric")
plt.plot(data['TK'], data['Cp'], 'k+')
p = plt.plot(data['TK'], cp_rbf(data['TK']), 'r-')
高维 RBF 插值:
from mpl_toolkits.mplot3d import Axes3D
x, y = np.mgrid[-np.pi/2:np.pi/2:5j, -np.pi/2:np.pi/2:5j]
z = np.cos(np.sqrt(x**2 + y**2))

zz = Rbf(x, y, z)
xx, yy = np.mgrid[-np.pi/2:np.pi/2:50j, -np.pi/2:np.pi/2:50j]
fig = plt.figure(figsize=(12,6))
ax = fig.gca(projection="3d")
ax.plot_surface(xx,yy,zz(xx,yy),rstride=1, cstride=1, cmap=plt.cm.jet)
2.概率统计方法
Scipy 中的子库 scipy.stats 中包含很多统计上的方法
Numpy 自带简单的统计方法:mean(),min(),max(),std()
import scipy.stats.stats as st
print 'median, ', st.nanmedian(heights)    # 忽略nan值之后的中位数
print 'mode, ', st.mode(heights)           # 众数及其出现次数
print 'skewness, ', st.skew(heights)       # 偏度
print 'kurtosis, ', st.kurtosis(heights)   # 峰度
(1)连续分布,以正态分布为例:
from scipy.stats import norm它包含四类常用的函数:
norm.cdf返回对应的累计分布函数值norm.pdf返回对应的概率密度函数值norm.rvs产生指定参数的随机变量norm.fit返回给定数据下,各参数的最大似然估计(MLE)值
#产生正态分布,通过 loc 和 scale 来调整参数
p = plot(x, norm.pdf(x, loc=0, scale=1))
p = plot(x, norm.pdf(x, loc=0.5, scale=2))
p = plot(x, norm.pdf(x, loc=-0.5, scale=.5))
(2)离散分布,没有概率密度函数,但是有概率质量函数 PMF
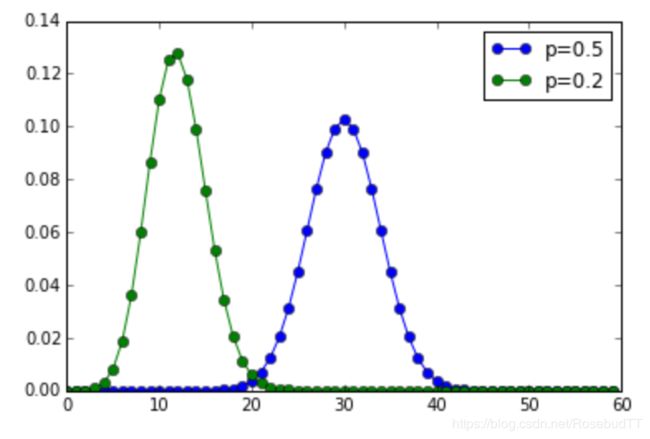
from scipy.stats import binom, poisson, randint二项分布:
num_trials = 60
x = arange(num_trials)

plot(x, binom(num_trials, 0.5).pmf(x), 'o-', label='p=0.5')
plot(x, binom(num_trials, 0.2).pmf(x), 'o-', label='p=0.2')

legend()
自定义离散分布:
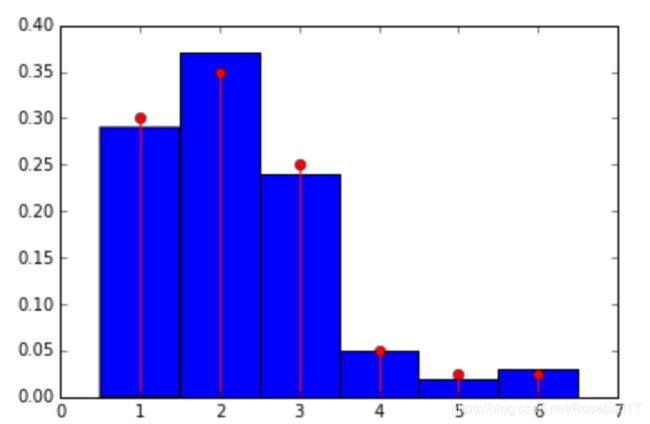
from scipy.stats import rv_discrete
xk = [1, 2, 3, 4, 5, 6]
pk = [.3, .35, .25, .05, .025, .025]
#定义离散分布,此时, loaded 可以当作一个离散分布的模块来使用
loaded = rv_discrete(values=(xk, pk))

#产生100个随机变量,将直方图与概率质量函数进行比较
samples = loaded.rvs(size=100)
bins = linspace(.5,6.5,7)

hist(samples, bins=bins, normed=True)
stem(xk, loaded.pmf(xk), markerfmt='ro', linefmt='r-')
(3)举例:
配对样本t检验:指的是两组样本之间的元素一一对应
例如,假设我们有一组病人的数据
pop_size = 35

pre_treat = norm(loc=0, scale=1)
n0 = pre_treat.rvs(size=pop_size)
经过某种治疗后,对这组病人得到一组新的数据:
effect = norm(loc=0.05, scale=0.2)
eff = effect.rvs(size=pop_size)

n1 = n0 + eff
新数据的最大似然估计:
loc, scale = norm.fit(n1)
post_treat = norm(loc=loc, scale=scale)
fig = figure(figsize=(10,4))
ax1 = fig.add_subplot(1,2,1)
h = ax1.hist([n0, n1], normed=True)
p = ax1.plot(x, pre_treat.pdf(x), 'b-')
p = ax1.plot(x, post_treat.pdf(x), 'g-')
ax2 = fig.add_subplot(1,2,2)
h = ax2.hist(eff, normed=True)t_val, p = ttest_rel(n0, n1)
print 't = {}'.format(t_val)
print 'p-value = {}'.format(p)t = -1.89564459709
p-value = 0.0665336223673配对 t 检验的结果说明,配对样本之间存在显著性差异,说明治疗时有效的,符合我们的预期。
3.曲线拟合
(1)多项式:
#导入线多项式拟合工具:
from numpy import polyfit, poly1d

x = np.linspace(-5, 5, 100)
y = 4 * x + 1.5
noise_y = y + np.random.randn(y.shape[-1]) * 2.5

coeff = polyfit(x, noise_y, 1)

p = plt.plot(x, noise_y, 'rx')
p = plt.plot(x, coeff[0] * x + coeff[1], 'k-')
p = plt.plot(x, y, 'b--')

#还可以用 poly1d 生成一个以传入的 coeff 为参数的多项式函数:
#f = poly1d(coeff)
#p = plt.plot(x, noise_y, 'rx')
#p = plt.plot(x, f(x))
(2)最小二乘拟合
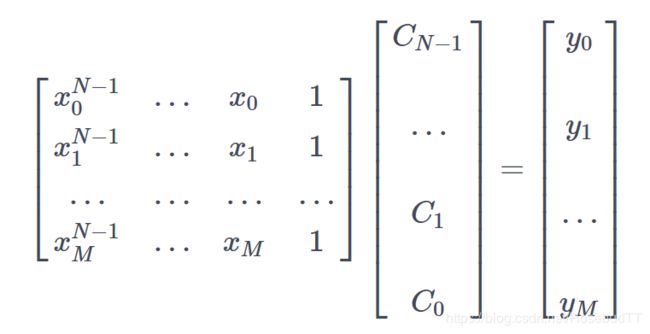
当我们使用一个 N-1 阶的多项式拟合这 M 个点时,有这样的关系存在:XC=Y
from scipy.linalg import lstsq
from scipy.stats import linregress

x = np.linspace(0,5,100)
y = 0.5 * x + np.random.randn(x.shape[-1]) * 0.35
X = np.hstack((x[:,np.newaxis], np.ones((x.shape[-1],1))))
C, resid, rank, s = lstsq(X, y)
p = plt.plot(x, y, 'rx')
p = plt.plot(x, C[0] * x + C[1], 'k--')
slope, intercept, r_value, p_value, stderr = linregress(x, y)
p = plt.plot(x, slope * x + intercept, 'k--')还有许多高级拟合方式,用时自查
4.最小化函数
(1)minimize 函数
已知斜抛运动的水平飞行距离公式:
d=2v20gsin(θ)cos(θ)d=2v02gsin(θ)cos(θ)
- dd 水平飞行距离
- v0v0 初速度大小
- gg 重力加速度
- θθ 抛出角度
希望找到使 dd 最大的角度 θ
def dist(theta, v0):
    """calculate the distance travelled by a projectile launched
    at theta degrees with v0 (m/s) initial velocity.
    """
    g = 9.8
    theta_rad = pi * theta / 180
    return 2 * v0 ** 2 / g * sin(theta_rad) * cos(theta_rad)
theta = linspace(0,90,90)

#最大化距离就相当于最小化距离的负数:
def neg_dist(theta, v0):
    return -1 * dist(theta, v0)
from scipy.optimize import minimize
result = minimize(neg_dist, 40, args=(1,))
print "optimal angle = {:.1f} degrees".format(result.x[0])minimize 接受三个参数:第一个是要优化的函数,第二个是初始猜测值,第三个则是优化函数的附加参数,默认 minimize 将优化函数的第一个参数作为优化变量,所以第三个参数输入的附加参数从优化函数的第二个参数开始。
(2)Rosenbrock 函数
Rosenbrock 函数是一个用来测试优化函数效果的一个非凸函数:
from scipy.optimize import rosen
from mpl_toolkits.mplot3d import Axes3D

x, y = meshgrid(np.linspace(-2,2,25), np.linspace(-0.5,3.5,25))
z = rosen([x,y])
fig = figure(figsize=(12,5.5))
ax = fig.gca(projection="3d")
ax.azim = 70; ax.elev = 48
ax.set_xlabel("X"); ax.set_ylabel("Y")
ax.set_zlim((0,1000))
p = ax.plot_surface(x,y,z,rstride=1, cstride=1, cmap=cm.jet)
rosen_min = ax.plot([1],[1],[0],"ro")
不同方法的计算开销量是不同的
5.积分
(1)符号积分
符号运算可以用 sympy 模块完成。
from sympy import init_printing #方便其显示
from sympy import symbols, integrate
import sympy

x, y = symbols('x y')
sympy.sqrt(x ** 2 + y ** 2)![]()
z = sympy.sqrt(x ** 2 + y ** 2)
z.subs(x, 3) #将其中的 x 利用 subs 方法替换为 3![]()
from sympy.abc import theta
y = sympy.sin(theta) ** 2
y
#对 y 进行积分
Y = integrate(y) ![]()
![]()
查看具体数值:
integrate(y, (theta, 0, sympy.pi)).evalf()
integrate(y, (theta, 0, np.pi))
(2)数值积分
导入贝塞尔函数
from scipy.special import jv
def f(x):
    return jv(2.5, x)
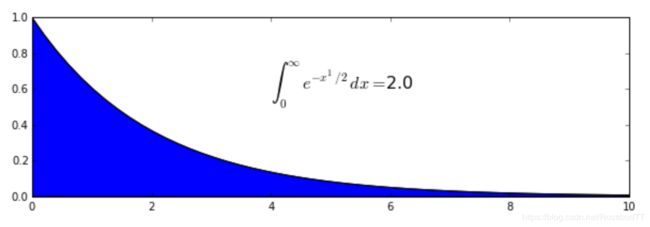
积分到无穷
from numpy import inf
interval = [0., inf]

def g(x):
    return np.exp(-x ** 1/2)
value, max_err = quad(g, *interval)
x = np.linspace(0, 10, 50)
fig = plt.figure(figsize=(10,3))
p = plt.plot(x, g(x), 'k-')
p = plt.fill_between(x, g(x))
plt.annotate(r"$\int_0^{\infty}e^{-x^1/2}dx = $" + "{}".format(value), (4, 0.6),
         fontsize=16)
print "upper bound on error: {:.1e}".format(max_err)
6.解微分方程
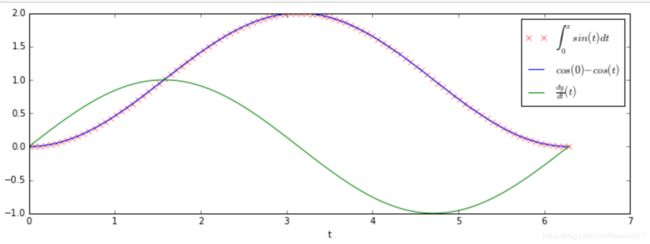
(1)简单一阶:
from scipy.integrate import odeint
def dy_dt(y, t):
    return np.sin(t)
t = np.linspace(0, 2*pi, 100)

result = odeint(dy_dt, 0, t)

fig = figure(figsize=(12,4))
p = plot(t, result, "rx", label=r"$\int_{0}^{x}sin(t) dt $")
p = plot(t, -cos(t) + cos(0), label=r"$cos(0) - cos(t)$")
p = plot(t, dy_dt(0, t), "g-", label=r"$\frac{dy}{dt}(t)$")
l = legend(loc="upper right")
xl = xlabel("t")
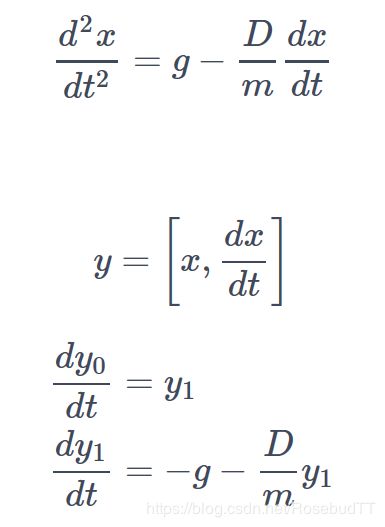
(2)高阶微分方程:
def dy_dt(y, t):
    """Governing equations for projectile motion with drag.
    y[0] = position
    y[1] = velocity
    g = gravity (m/s2)
    D = drag (1/s) = force/velocity
    m = mass (kg)
    """
    g = -9.8
    D = 0.1
    m = 0.15
    dy1 = g - (D/m) * y[1]
    dy0 = y[1] if y[0] >= 0 else 0.
    return [dy0, dy1]

position_0 = 0.
velocity_0 = 100
t = linspace(0, 12, 100)
y = odeint(dy_dt, [position_0, velocity_0], t)
p = plot(t, y[:,0])
yl = ylabel("Height (m)")
xl = xlabel("Time (s)")
7.稀疏矩阵
稀疏矩阵主要使用 位置 + 值 的方法来存储矩阵的非零元素,根据存储和使用方式的不同,有如下几种类型的稀疏矩阵:
| 类型 | 描述 |
|---|---|
bsr_matrix(arg1[, shape, dtype, copy, blocksize]) |
Block Sparse Row matrix |
coo_matrix(arg1[, shape, dtype, copy]) |
A sparse matrix in COOrdinate format. |
csc_matrix(arg1[, shape, dtype, copy]) |
Compressed Sparse Column matrix |
csr_matrix(arg1[, shape, dtype, copy]) |
Compressed Sparse Row matrix |
dia_matrix(arg1[, shape, dtype, copy]) |
Sparse matrix with DIAgonal storage |
dok_matrix(arg1[, shape, dtype, copy]) |
Dictionary Of Keys based sparse matrix. |
lil_matrix(arg1[, shape, dtype, copy]) |
Row-based linked list sparse matrix |
在这些存储格式中:
- COO 格式在构建矩阵时比较高效
- CSC 和 CSR 格式在乘法计算时比较高效
from scipy.sparse import *
import numpy as np

coo_matrix((2,3))
#也可以使用一个已有的矩阵或数组或列表中创建新矩阵:
A = coo_matrix([[1,2,0],[0,0,3],[4,0,5]])
(0, 0) 1 (0, 1) 2 (1, 2) 3 (2, 0) 4 (2, 2) 5
可以转化为普通矩阵:
C = A.todense()matrix([[1, 2, 0], [0, 0, 3], [4, 0, 5]])
还可以传入一个 (data, (row, col)) 的元组来构建稀疏矩阵:
I = np.array([0,3,1,0])
J = np.array([0,3,1,2])
V = np.array([4,5,7,9])
A = coo_matrix((V,(I,J)),shape=(4,4))
print A
(0, 0) 4 (3, 3) 5 (1, 1) 7 (0, 2) 9
8.线性代数
import numpy as np
import numpy.linalg
import scipy as sp
import scipy.linalg
import matplotlib.pyplot as plt
from scipy import linalg
scipy.linalg 包含 numpy.linalg 中的所有函数,同时还包含了很多 numpy.linalg 中没有的函数,在使用时,我们一般使用 scipy.linalg 而不是 numpy.linalg
(1)求解方程
A = np.array([[1, 3, 5],
              [2, 5, 1],
              [2, 3, 8]])
b = np.array([10, 8, 3])
x = linalg.solve(A, b)
(2)计算行列式
A = np.array([[1, 3, 5],
              [2, 5, 1],
              [2, 3, 8]])

linalg.det(A)
(3)矩阵分解
对于给定的 N×NN×N 矩阵 AA,特征值和特征向量问题相当与寻找标量 λλ 和对应的向量 vv 使得:
Av=λvAv=λv
矩阵的 NN 个特征值(可能相同)可以通过计算特征方程的根得到:
|A−λI|=0|A−λI|=0
然后利用这些特征值求(归一化的)特征向量。
问题求解
linalg.eig(A)- 返回矩阵的特征值与特征向量
linalg.eigvals(A)- 返回矩阵的特征值
linalg.eig(A, B)- 求解 Av=λBvAv=λBv 的问题
(4)对稀疏矩阵
scipy.sparse.linalg.inv- 稀疏矩阵求逆
scipy.sparse.linalg.expm- 求稀疏矩阵的指数函数
scipy.sparse.linalg.norm- 稀疏矩阵求范数
对于特别大的矩阵,原来的方法可能需要太大的内存,考虑使用这两个方法替代:
scipy.sparse.linalg.eigs- 返回前 k 大的特征值和特征向量
scipy.sparse.linalg.svds- 返回前 k 大的奇异值和奇异向量
