TITANIC DATA PREDICTATION
ok, 这是我自己做的titanic建模,主要过程是:
探索数据:
看下数据维度,数据简单统计
数据类型(数值型,对象型)、
是否有空值,多少空值
用matplotlib绘图探索数据
数据预处理:
填充空值数据
转换分类变量
数据标准化,可在建模时转换
feature很多时要降维 PCA SVD
数据建模:
模型评估:
分类:precision/recall ,f1 score, pr tradeoff图
回归: MAE/ MSE/ R平方
import numpy as np
import pandas as pd
import matplotlib.pyplot as plt

%matplotlib inline
import dataset
train = pd.read_csv("E:/figure/titanic/train.csv")
test = pd.read_csv("E:/figure/titanic/test.csv")
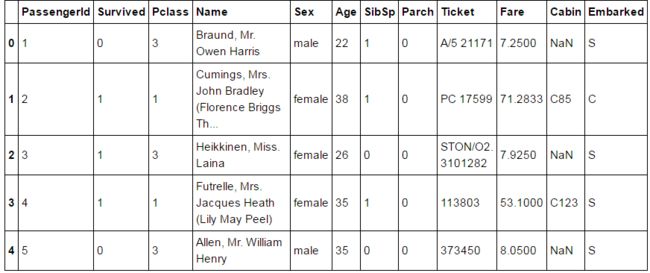
train.head()
•Survived: Outcome of survival (0 = No; 1 = Yes)
•Pclass: Socio-economic class (1 = Upper class; 2 = Middle class; 3 = Lower class)
•Name: Name of passenger
•Sex: Sex of the passenger
•Age: Age of the passenger (Some entries contain NaN)
•SibSp: Number of siblings and spouses of the passenger aboard
•Parch: Number of parents and children of the passenger aboard
•Ticket: Ticket number of the passenger
•Fare: Fare paid by the passenger
•Cabin Cabin number of the passenger (Some entries contain NaN)
•Embarked: Port of embarkation of the passenger (C = Cherbourg; Q = Queenstown; S = Southampton)
explore dataset
print(train.shape)
print(test.shape)
(891, 12)
(418, 11)
train.dtypes
PassengerId      int64
Survived         int64
Pclass           int64
Name            object
Sex             object
Age            float64
SibSp            int64
Parch            int64
Ticket          object
Fare           float64
Cabin           object
Embarked        object
dtype: object
test.dtypes
PassengerId      int64
Pclass           int64
Name            object
Sex             object
Age            float64
SibSp            int64
Parch            int64
Ticket          object
Fare           float64
Cabin           object
Embarked        object
dtype: object
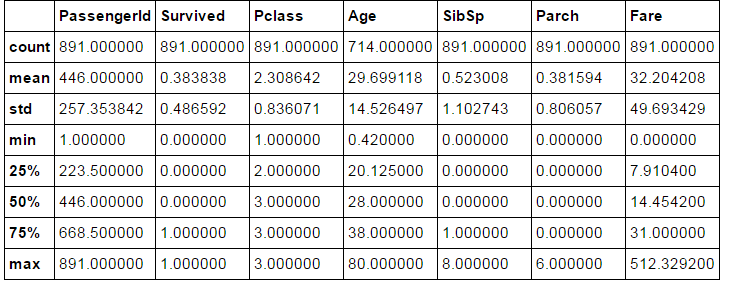
train.describe()
merge training set and testing set
full =pd.merge(train,test,how="outer")
full.info()
Int64Index: 1309 entries, 0 to 1308
Data columns (total 12 columns):
PassengerId    1309 non-null float64
Survived       891 non-null float64
Pclass         1309 non-null float64
Name           1309 non-null object
Sex            1309 non-null object
Age            1046 non-null float64
SibSp          1309 non-null float64
Parch          1309 non-null float64
Ticket         1309 non-null object
Fare           1308 non-null float64
Cabin          295 non-null object
Embarked       1307 non-null object
dtypes: float64(7), object(5)
memory usage: 107.4+ KB
#check missing value

full.isnull().sum()
PassengerId       0
Survived        418
Pclass            0
Name              0
Sex               0
Age             263
SibSp             0
Parch             0
Ticket            0
Fare              1
Cabin          1014
Embarked          2
dtype: int64
print(full["Pclass"].value_counts(),"\n",full["Sex"].value_counts(),"\n",full["Embarked"].value_counts())
3    709
1    323
2    277
Name: Pclass, dtype: int64
 male      843
female    466
Name: Sex, dtype: int64
 S    914
C    270
Q    123
Name: Embarked, dtype: int64
data preprocessing
#dummy variable
full=pd.get_dummies(full,columns=["Pclass","Embarked","Sex"])
#drop variable
full=full.drop(["Cabin","PassengerId","Name","Ticket"],axis=1)
full.dtypes
Survived      float64
Age           float64
SibSp         float64
Parch         float64
Fare          float64
Pclass_1.0    float64
Pclass_2.0    float64
Pclass_3.0    float64
Embarked_C    float64
Embarked_Q    float64
Embarked_S    float64
Sex_female    float64
Sex_male      float64
dtype: object
#replace "Age" missing value to -999
full["Age"].fillna(-999,inplace =True)
full["Age"]=full["Age"].astype(int)
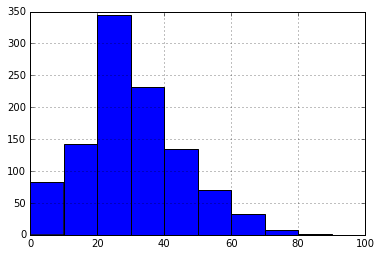
full["Age"].hist(bins=10,range=(0,100))
#replace nan value with mean
full["Fare"].loc[full["Fare"].isnull()]=full["Fare"].mean()
C:\Anaconda3\lib\site-packages\pandas\core\indexing.py:117: SettingWithCopyWarning:
A value is trying to be set on a copy of a slice from a DataFrame

See the caveats in the documentation: http://pandas.pydata.org/pandas-docs/stable/indexing.html#indexing-view-versus-copy
  self._setitem_with_indexer(indexer, value)
full.isnull().sum()
Survived      418
Age             0
SibSp           0
Parch           0
Fare            0
Pclass_1.0      0
Pclass_2.0      0
Pclass_3.0      0
Embarked_C      0
Embarked_Q      0
Embarked_S      0
Sex_female      0
Sex_male        0
dtype: int64
trainset =full.iloc[:891,]
testset=full.iloc[891:,]
from sklearn.linear_model import LogisticRegression
from sklearn.svm import SVC
from sklearn.ensemble import RandomForestClassifier
from sklearn.naive_bayes import GaussianNB
from sklearn.metrics import f1_score
from sklearn.metrics import precision_recall_curve
x_train = trainset.drop("Survived",axis=1)
y_train = trainset["Survived"]
x_test = testset.drop("Survived",axis=1)
#logistic regression
logreg =LogisticRegression()
logreg.fit(x_train,y_train)
y_predlog = logreg.predict(x_test)
logreg.score(x_train,y_train)
0.7991021324354658
print f1 score and plot pr curve(it's on trainset)
f1_score(y_train,logreg.predict(x_train))
0.72248062015503878
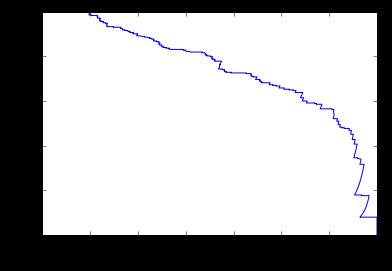
prob = logreg.predict_proba(x_train)
precision, recall, thresholds = precision_recall_curve(y_train,prob[:,1])
plt.plot(precision,recall)
plt.xlabel("precision")
plt.ylabel("recall")
from sklearn.metrics import classification_report
print(classification_report(y_train,logreg.predict(x_train),target_names=["unsurvived","survived"]))
             precision    recall  f1-score   support

 unsurvived       0.81      0.87      0.84       549
   survived       0.77      0.68      0.72       342

avg / total       0.80      0.80      0.80       891
#SVC
svc =SVC()
svc.fit(x_train,y_train)
y_predsvc = svc.predict(x_test)
svc.score(x_train,y_train)
0.88776655443322106
#rrandom forest
rf = RandomForestClassifier()
rf.fit(x_train,y_train)
y_predrf = rf.predict(x_test)
rf.score(x_train,y_train)
0.97081930415263751
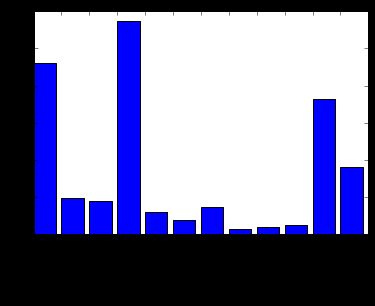
**feature importances
importanted = rf.feature_importances_
print(importanted)
plt.bar(range(x_train.shape[1]),importanted)
plt.xticks(range(x_train.shape[1]),tuple(x_train.columns),rotation=60)
[ 0.23063155  0.04861788  0.04546831  0.28729027  0.02962199  0.01930221
  0.03710312  0.00726902  0.00953395  0.0125742   0.18180419  0.09078331]


([,
  ,
  ,
  ,
  ,
  ,
  ,
  ,
  ,
  ,
  ,
  ],
 )
from the pic, you can see "age", "fare"and "sex" are more important variance.
There must be some relation between fare and Pclass, do that later.
#Gaussian NB
nb = GaussianNB()
nb.fit(x_train,y_train)
y_prednb=nb.predict(x_test)
nb.score(x_train,y_train)
0.78114478114478114
#standard
from sklearn.preprocessing import StandardScaler
std = StandardScaler()
std.fit(x_train)
x_train_std = std.transform(x_train)
x_test_std = std.transform(x_test)
#train on this later
#save prediction as csv
#submission = pd.DataFrame({"PassengerId":test["PassengerId"],"Survived":y_predlog})
#submission.to_csv("titanicpred.csv",index=False)
