如何用Jupyter Notebook制作新冠病毒疫情追踪器?
![]()
![]()
出品 | AI科技大本营(ID:rgznai100)
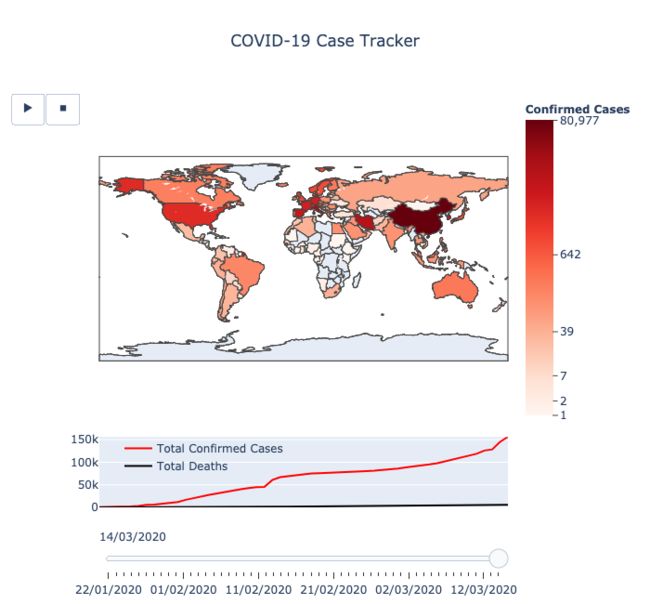
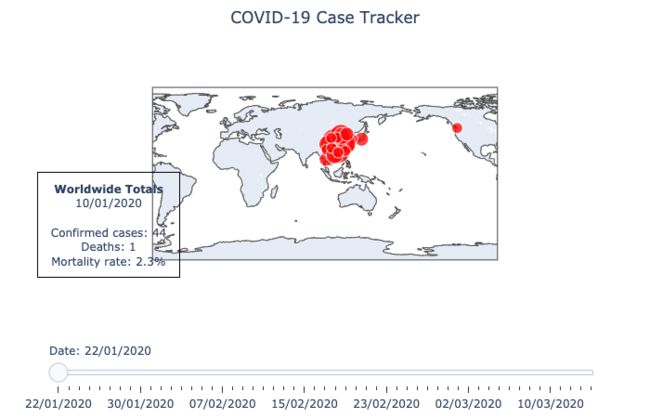
新冠肺炎已在全球范围内爆发。为了解全球疫情分布情况,有技术人员使用Jupyter Notebook绘制了两种疫情的等值线地图(choropleth chart)和散点图。
前者显示了一个国家/地区的疫情扩散情况:该国家/地区的在地图上的颜色越深,其确诊案例越多。其中的播放键可以为图表制作动画,同时还可以使用滑块手动更改日期。
第二个散点图中的红点则表明其大小与某一特定地点的确诊病例数量成对数比例。这个图表的分辨率更高,数据呈现的是州/省一级的疫情情况。
最终的疫情地图显示效果清晰明了,以下为作者分享的全部代码:
from datetime import datetimeimport re
from IPython.display import displayimport numpy as npimport pandas as pdimport plotly.graph_objects as gofrom plotly.subplots import make_subplots
pd.options.display.max_columns = 12
date_pattern = re.compile(r"\d{1,2}/\d{1,2}/\d{2}")def reformat_dates(col_name: str) -> str: # for columns which are dates, I'd much rather they were in day/month/year format try: return date_pattern.sub(datetime.strptime(col_name, "%m/%d/%y").strftime("%d/%m/%Y"), col_name, count=1) except ValueError: return col_name
# this github repo contains timeseries data for all coronavirus cases: https://github.com/CSSEGISandData/COVID-19confirmed_cases_url = "https://raw.githubusercontent.com/CSSEGISandData/COVID-19/master/csse_covid_19_data/" \ "csse_covid_19_time_series/time_series_19-covid-Confirmed.csv"deaths_url = "https://raw.githubusercontent.com/CSSEGISandData/COVID-19/master/csse_covid_19_data/" \ "csse_covid_19_time_series/time_series_19-covid-Deaths.csv"
![]() 等值线地图
等值线地图
renamed_columns_map = {   "Country/Region": "country",   "Province/State": "location",   "Lat": "latitude",   "Long": "longitude"}
cols_to_drop = ["location", "latitude", "longitude"]
confirmed_cases_df = (   pd.read_csv(confirmed_cases_url)   .rename(columns=renamed_columns_map)   .rename(columns=reformat_dates)   .drop(columns=cols_to_drop))deaths_df = (   pd.read_csv(deaths_url)   .rename(columns=renamed_columns_map)   .rename(columns=reformat_dates)   .drop(columns=cols_to_drop))
display(confirmed_cases_df.head())display(deaths_df.head())
# extract out just the relevant geographical data and join it to another .csv which has the country codes.# The country codes are required for the plotting function to identify countries on the mapgeo_data_df = confirmed_cases_df[["country"]].drop_duplicates()country_codes_df = ( pd.read_csv( "country_code_mapping.csv", usecols=["country", "alpha-3_code"], index_col="country"))geo_data_df = geo_data_df.join(country_codes_df, how="left", on="country").set_index("country")
# my .csv file of country codes and the COVID-19 data source disagree on the names of some countries. This # dataframe should be empty, otherwise it means I need to edit the country name in the .csv to matchgeo_data_df[(pd.isnull(geo_data_df["alpha-3_code"])) & (geo_data_df.index != "Cruise Ship")
输出:
dates_list = (    deaths_df.filter(regex=r"(\d{2}/\d{2}/\d{4})", axis=1)    .columns    .to_list())
# create a mapping of date -> dataframe, where each df holds the daily counts of cases and deaths per countrycases_by_date = {}for date in dates_list:    confirmed_cases_day_df = (        confirmed_cases_df        .filter(like=date, axis=1)        .rename(columns=lambda col: "confirmed_cases")    )    deaths_day_df = deaths_df.filter(like=date, axis=1).rename(columns=lambda col: "deaths")    cases_df = confirmed_cases_day_df.join(deaths_day_df).set_index(confirmed_cases_df["country"])
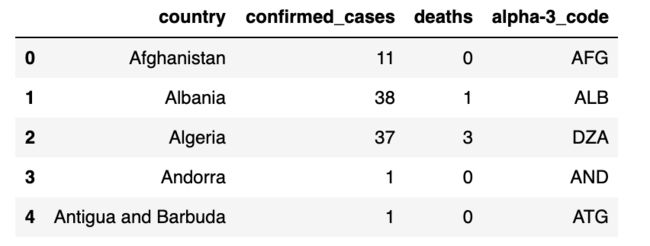
    date_df = (        geo_data_df.join(cases_df)        .groupby("country")        .agg({"confirmed_cases": "sum", "deaths": "sum", "alpha-3_code": "first"})    )    date_df = date_df[date_df["confirmed_cases"] > 0].reset_index()        cases_by_date[date] = date_df    # the dataframe for each day looks something like this:cases_by_date[dates_list[-1]].head()
输出:
# helper function for when we produce the frames for the map animationdef frame_args(duration): return { "frame": {"duration": duration}, "mode": "immediate", "fromcurrent": True, "transition": {"duration": duration, "easing": "linear"}, }
fig = make_subplots(rows=2, cols=1, specs=[[{"type": "scattergeo"}], [{"type": "xy"}]], row_heights=[0.8, 0.2])
# set up the geo data, the slider, the play and pause buttons, and the titlefig.layout.geo = {"showcountries": True}fig.layout.sliders = [{"active": 0, "steps": []}]fig.layout.updatemenus = [    {        "type": "buttons",        "buttons": [            {                "label": "▶",  # play symbol                "method": "animate",                "args": [None, frame_args(250)],            },            {                "label": "◼",                "method": "animate",  # stop symbol                "args": [[None], frame_args(0)],            },        ],        "showactive": False,        "direction": "left",    }]fig.layout.title = {"text": "COVID-19 Case Tracker", "x": 0.5}
frames = []steps = []# set up colourbar tick values, ranging from 1 to the highest num. of confirmed cases for any country thus farmax_country_confirmed_cases = cases_by_date[dates_list[-1]]["confirmed_cases"].max()
# to account for the significant variance in number of cases, we want the scale to be logarithmic...high_tick = np.log1p(max_country_confirmed_cases)low_tick = np.log1p(1)log_tick_values = np.geomspace(low_tick, high_tick, num=6)
# ...however, we want the /labels/ on the scale to be the actual number of cases (i.e. not log(n_cases))visual_tick_values = np.expm1(log_tick_values).astype(int)# explicitly set max cbar value, otherwise it might be max - 1 due to a rounding errorvisual_tick_values[-1] = max_country_confirmed_cases visual_tick_values = [f"{val:,}" for val in visual_tick_values]
# generate line chart data# list of tuples: [(confirmed_cases, deaths), ...]cases_deaths_totals = [(df.filter(like="confirmed_cases").astype("uint32").agg("sum")[0], df.filter(like="deaths").astype("uint32").agg("sum")[0]) for df in cases_by_date.values()]
confirmed_cases_totals = [daily_total[0] for daily_total in cases_deaths_totals]deaths_totals =[daily_total[1] for daily_total in cases_deaths_totals]
# this loop generates the data for each framefor i, (date, data) in enumerate(cases_by_date.items(), start=1): df = data
# the z-scale (for calculating the colour for each country) needs to be logarithmic df["confirmed_cases_log"] = np.log1p(df["confirmed_cases"])
df["text"] = ( date + "
" + df["country"] + "
Confirmed cases: " + df["confirmed_cases"].apply(lambda x: "{:,}".format(x)) + "
Deaths: " + df["deaths"].apply(lambda x: "{:,}".format(x)) )
# create the choropleth chart choro_trace = go.Choropleth( **{ "locations": df["alpha-3_code"], "z": df["confirmed_cases_log"], "zmax": high_tick, "zmin": low_tick, "colorscale": "reds", "colorbar": { "ticks": "outside", "ticktext": visual_tick_values, "tickmode": "array", "tickvals": log_tick_values, "title": {"text": "Confirmed Cases"}, "len": 0.8, "y": 1, "yanchor": "top" }, "hovertemplate": df["text"], "name": "", "showlegend": False } ) # create the confirmed cases trace confirmed_cases_trace = go.Scatter( x=dates_list, y=confirmed_cases_totals[:i], mode="markers" if i == 1 else "lines", name="Total Confirmed Cases", line={"color": "Red"}, hovertemplate="%{x}
Total confirmed cases: %{y:,}
Total deaths: %{y:,}![]()
疫情散点图
renamed_columns_map = {    "Country/Region": "country",    "Province/State": "location",    "Lat": "latitude",    "Long": "longitude"}
confirmed_cases_df = (    pd.read_csv(confirmed_cases_url)    .rename(columns=renamed_columns_map)    .rename(columns=reformat_dates)    .fillna(method="bfill", axis=1))deaths_df = (    pd.read_csv(deaths_url)    .rename(columns=renamed_columns_map)    .rename(columns=reformat_dates)    .fillna(method="bfill", axis=1))
display(confirmed_cases_df.head())display(deaths_df.head())
fig = go.Figure()
geo_data_cols = ["country", "location", "latitude", "longitude"]geo_data_df = confirmed_cases_df[geo_data_cols]dates_list = (    confirmed_cases_df.filter(regex=r"(\d{2}/\d{2}/\d{4})", axis=1)    .columns    .to_list())
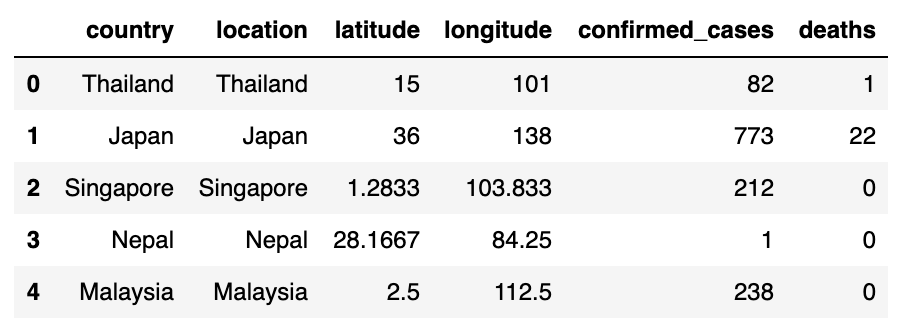
# create a mapping of date -> dataframe, where each df holds the daily counts of cases and deaths per countrycases_by_date = {}for date in dates_list:    # get a pd.Series of all cases for the current day    confirmed_cases_day_df = (        confirmed_cases_df.filter(like=date, axis=1)        .rename(columns=lambda col: "confirmed_cases")        .astype("uint32")    )        # get a pd.Series of all deaths for the current day    deaths_day_df = (        deaths_df.filter(like=date, axis=1)        .rename(columns=lambda col: "deaths")        .astype("uint32")    )        cases_df = confirmed_cases_day_df.join(deaths_day_df)  # combine the cases and deaths dfs    cases_df = geo_data_df.join(cases_df)  # add in the geographical data    cases_df = cases_df[cases_df["confirmed_cases"] > 0]  # get rid of any rows where there were no cases        cases_by_date[date] = cases_df    # each dataframe looks something like this:cases_by_date[dates_list[-1]].head()
输出:
# generate the data for each dayfig.data = []for date, df in cases_by_date.items():    df["confirmed_cases_norm"] = np.log1p(df["confirmed_cases"])    df["text"] = (        date        + "
"        + df["country"]        + "
"        + df["location"]        + "
Confirmed cases: "        + df["confirmed_cases"].astype(str)        + "
Deaths: "        + df["deaths"].astype(str)    )    fig.add_trace(        go.Scattergeo(            name="",            lat=df["latitude"],            lon=df["longitude"],            visible=False,            hovertemplate=df["text"],            showlegend=False,            marker={                "size": df["confirmed_cases_norm"] * 100,                "color": "red",                "opacity": 0.75,                "sizemode": "area",            },        )    )
# sort out the nitty gritty of the annotations and slider stepsannotation_text_template = "Worldwide Totals" \                           "
{date}

" \                           "Confirmed cases: {confirmed_cases:,d}
" \                           "Deaths: {deaths:,d}
" \                           "Mortality rate: {mortality_rate:.1%}"annotation_dict = {    "x": 0.03,    "y": 0.35,    "width": 150,    "height": 110,    "showarrow": False,    "text": "",    "valign": "middle",    "visible": False,    "bordercolor": "black",}
steps = []for i, data in enumerate(fig.data):    step = {        "method": "update",        "args": [            {"visible": [False] * len(fig.data)},            {"annotations": [dict(annotation_dict) for _ in range(len(fig.data))]},        ],        "label": dates_list[i],    }
    # toggle the i'th trace and annotation box to visible    step["args"][0]["visible"][i] = True    step["args"][1]["annotations"][i]["visible"] = True
    df = cases_by_date[dates_list[i]]    confirmed_cases = df["confirmed_cases"].sum()    deaths = df["deaths"].sum()    mortality_rate = deaths / confirmed_cases    step["args"][1]["annotations"][i]["text"] = annotation_text_template.format(        date=dates_list[i],        confirmed_cases=confirmed_cases,        deaths=deaths,        mortality_rate=mortality_rate,    )
    steps.append(step)
sliders = [    {        "active": 0,        "currentvalue": {"prefix": "Date: "},        "steps": steps,        "len": 0.9,        "x": 0.05,    }]
first_annotation_dict = {**annotation_dict}first_annotation_dict.update(    {        "visible": True,        "text": annotation_text_template.format(            date="10/01/2020", confirmed_cases=44, deaths=1, mortality_rate=0.0227        ),    })fig.layout.title = {"text": "COVID-19 Case Tracker", "x": 0.5}fig.update_layout(    height=650,    margin={"t": 50, "b": 20, "l": 20, "r": 20},    annotations=[go.layout.Annotation(**first_annotation_dict)],    sliders=sliders,)fig.data[0].visible = True  # set the first data point visible
fig
# save the figure locally as an interactive HTML pagefig.update_layout(height=1000)fig.write_html("nCoV_tracker.html")
来源:
https://mfreeborn.github.io/blog/2020/03/15/interactive-coronavirus-map-with-jupyter-notebook#Chart-1---A-Choropleth-Chart
【end】

◆有奖征文◆


推荐阅读超轻量级中文OCR,支持竖排文字识别、ncnn推理,总模型仅17M网红直播时的瘦脸、磨皮等美颜功能是如何实现的?比特币最主流,以太坊大跌,区块链技术“万金油”红利已结束 | 区块链开发者年度报告一文了解 Spring Boot 服务监控,健康检查,线程信息,JVM堆信息,指标收集,运行情况监控!用 3 个“鸽子”,告诉你闪电网络是怎样改变加密消息传递方式的!出生小镇、高考不顺、复旦执教、闯荡硅谷,59 岁陆奇为何如此“幸运”?你点的每个“在看”,我都认真当成了AI


