逻辑回归评分卡实现和评估
评分卡实现和评估
上一节讲得是模型评估,主要有ROC曲线、KS曲线、学习曲线和混淆矩阵。今天学习如何实现评分卡和对评分卡进行评估。
首先,要了解评分卡是如何从概率映射到评分的,这个之前写过评分卡映射的逻辑。见逻辑回归卡评分映射逻辑,一定要看,明白概率如何映射到评分的以及每个变量的得分如何计算。附上评分卡映射的代码。结合逻辑回归评分卡映射的原理才能看懂代码。
from sklearn.linear_model import LogisticRegression
'''
第六步:逻辑回归模型。
要求:
1,变量显著
2,符号为负
'''
y = trainData['y']
x = trainData[multi_analysis]

lr_model = LogisticRegression(C=0.1)
lr_model.fit(x,y)
trainData['prob'] = lr_model.predict_proba(x)[:,1]

# 评分卡刻度
def cal_scale(score,odds,PDO,model):
    """
    odds:设定的坏好比
    score:在这个odds下的分数
    PDO: 好坏翻倍比
    model:逻辑回归模型

    return :A,B,base_score
    """
    B = PDO/np.log(2)
    A = score+B*np.log(odds)
    # base_score = A+B*model.intercept_[0]
    print('B: {:.2f}'.format(B))
    print('A: {:.2f}'.format(A))
    # print('基础分为:{:.2f}'.format(base_score))
    return A,B

#假设基础分为50,odds为5%,PDO为10,可以自行调整。这一步是为了计算出A和B。
cal_scale(50,0.05,10,lr_model)

def Prob2Score(prob, A,B):
    #将概率转化成分数且为正整数
    y = np.log(prob/(1-prob))
    return float(A-B*y)

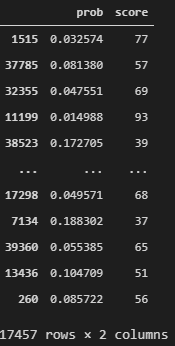
trainData['score'] = trainData['prob'].map(lambda x:Prob2Score(x, 6.78,14.43))
可以看到,评分越高,违约概率越低。网上很多实现评分卡映射的代码,都没太看懂,这个是根据逻辑来写的,有时间再把映射逻辑整理一下。
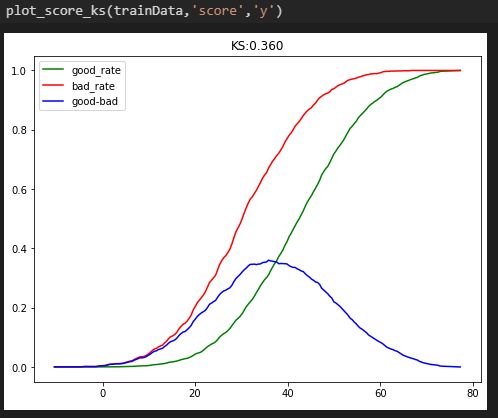
1. 得分的KS曲线
和模型的KS曲线一样,只不过横坐标的概率变成了得分。
直接放上代码。
# 得分的KS
def plot_score_ks(df,score_col,target):
    """
    df:数据集
    target:目标变量的字段名
    score_col:最终得分的字段名
    """
    total_bad = df[target].sum()
    total_good = df[target].count()-total_bad
    score_list = list(df[score_col])
    target_list = list(df[target])
    items = sorted(zip(score_list,target_list),key=lambda x:x[0])
    step = (max(score_list)-min(score_list))/200

    score_bin=[]
    good_rate=[]
    bad_rate=[]
    ks_list = []
    for i in range(1,201):
        idx = min(score_list)+i*step
        score_bin.append(idx)
        target_bin = [x[1] for x in items if x[0]<idx]
        bad_num = sum(target_bin)
        good_num = len(target_bin)-bad_num
        goodrate = good_num/total_good
        badrate = bad_num/total_bad
        ks = abs(goodrate-badrate)
        good_rate.append(goodrate)
        bad_rate.append(badrate)
        ks_list.append(ks)

    fig = plt.figure(figsize=(8,6))
    ax = fig.add_subplot(1,1,1)
    ax.plot(score_bin,good_rate,color='green',label='good_rate')
    ax.plot(score_bin,bad_rate,color='red',label='bad_rate')
    ax.plot(score_bin,ks_list,color='blue',label='good-bad')
    ax.set_title('KS:{:.3f}'.format(max(ks_list)))
    ax.legend(loc='best')
    return plt.show(ax)
2. PR曲线
还是这个混淆矩阵的图,P是查准率、精确率,R是查全率、召回率。这两个指标时既矛盾又统一的。因为为了提高精确率P,就是要更准确地预测正样本,但此时往往会过于保守而漏掉很多没那么有把握的正样本,导致召回率R降低。
同ROC曲线的形成一样,PR曲线的形成也是不断移动截断点形成不同的(R,P)绘制成一条线。
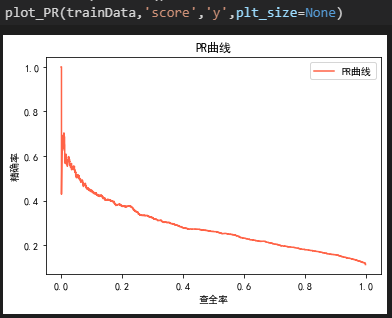
当接近原点时,召回率R接近于0,精确率P较高,说明得分前几位的都是正样本。随着召回率的增加,精确率整体下降,当召回率为1时,说明所有的正样本都被挑了出来,此时的精确率很低,其实就是相当于你将大部分的样本都预测为正样本。注意,只用某个点对应的(R,P)无法全面衡量模型的性能,必须要通过PR曲线的整体表现。此外,还有F1 score和ROC曲线也能反映一个排序模型的性能。
- PR曲线和ROC曲线的区别
当正负样本的分布发生变化时,ROC曲线的形状基本不变,PR曲线形状会发生剧烈变化。上图中PR曲线整体较低就是因为正负样本不均衡导致的。因为比如评分卡中坏客户只有1%,好客户有99%,将全部客户预测为好客户,那么准确率依然有99%。虽然模型整体的准确率很高,但并不代表对坏客户的分类准确率也高,这里坏客户的分类准确率为0,召回率也为0。
# PR曲线
def plot_PR(df,score_col,target,plt_size=None):
    """
    df:得分的数据集
    score_col:分数的字段名
    target:目标变量的字段名
    plt_size:绘图尺寸

    return: PR曲线
    """
    total_bad = df[target].sum()
    score_list = list(df[score_col])
    target_list = list(df[target])
    score_unique_list = sorted(set(list(df[score_col])))
    items = sorted(zip(score_list,target_list),key=lambda x:x[0])

    precison_list = []
    tpr_list = []
    for score in score_unique_list:
        target_bin = [x[1] for x in items if x[0]<=score]
        bad_num = sum(target_bin)
        total_num = len(target_bin)
        precison = bad_num/total_num
        tpr = bad_num/total_bad
        precison_list.append(precison)
        tpr_list.append(tpr)

    plt.figure(figsize=plt_size)
    plt.title('PR曲线')
    plt.xlabel('查全率')
    plt.ylabel('精确率')
    plt.plot(tpr_list,precison_list,color='tomato',label='PR曲线')
    plt.legend(loc='best')
    return plt.show()
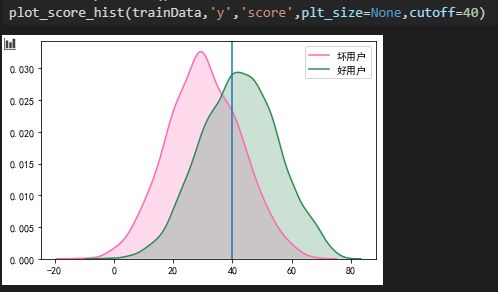
3.得分分布图
理想中最好的评分卡模型应该是将好坏客户完全区分出来,但是实际中好坏用户的评分会有一定的重叠,我们要做的尽量减小重叠。
另外好坏用户的得分分布最好都是正态分布,如果呈双峰或多峰分布,那么很有可能是某个变量的得分过高导致,这样对评分卡的稳定性会有影响。
# 得分分布图
def plot_score_hist(df,target,score_col,plt_size=None,cutoff=None):
    """
    df:数据集
    target:目标变量的字段名
    score_col:最终得分的字段名
    plt_size:图纸尺寸
    cutoff :划分拒绝/通过的点

    return :好坏用户的得分分布图
    """
    plt.figure(figsize=plt_size)
    x1 = df[df[target]==1][score_col]
    x2 = df[df[target]==0][score_col]
    sns.kdeplot(x1,shade=True,label='坏用户',color='hotpink')
    sns.kdeplot(x2,shade=True,label='好用户',color ='seagreen')
    plt.axvline(x=cutoff)
    plt.legend()
    return plt.show()
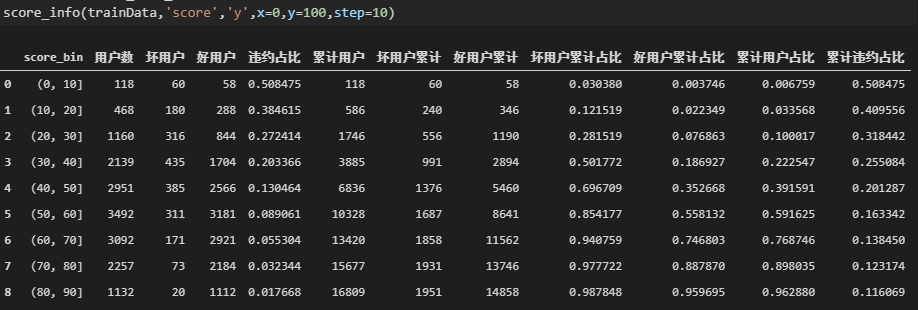
4.得分明细表
可以看到高分段的违约概率明显比低分段低,说明评分卡的效果是显著的。
# 得分明细表
def score_info(df,score_col,target,x=None,y=None,step=None):
    """
    df:数据集
    target:目标变量的字段名
    score_col:最终得分的字段名
    x:最小区间的左值
    y:最大区间的右值
    step:区间的分数间隔

    return :得分明细表
    """
    df['score_bin'] = pd.cut(df[score_col],bins=np.arange(x,y,step),right=True)
    total = df[target].count()
    bad = df[target].sum()
    good = total - bad

    group = df.groupby('score_bin')
    score_info_df = pd.DataFrame()
    score_info_df['用户数'] = group[target].count()
    score_info_df['坏用户'] = group[target].sum()
    score_info_df['好用户'] = score_info_df['用户数']-score_info_df['坏用户']
    score_info_df['违约占比'] = score_info_df['坏用户']/score_info_df['用户数']
    score_info_df['累计用户'] = score_info_df['用户数'].cumsum()
    score_info_df['坏用户累计'] = score_info_df['坏用户'].cumsum()
    score_info_df['好用户累计'] = score_info_df['好用户'].cumsum()
    score_info_df['坏用户累计占比'] = score_info_df['坏用户累计']/bad
    score_info_df['好用户累计占比'] = score_info_df['好用户累计']/good
    score_info_df['累计用户占比'] = score_info_df['累计用户']/total
    score_info_df['累计违约占比'] = score_info_df['坏用户累计']/score_info_df['累计用户']
    score_info_df = score_info_df.reset_index()
    return score_info_df
5.提升图和洛伦兹曲线
假设目前有10000个样本,坏用户占比为30%,我们做了一个评分卡(分数越低,用户坏的概率越高),按照评分从低到高划分成10等份(每个等份用户数为1000),计算每等份的坏用户占比,如果评分卡效果很好,那么越靠前的等份里,包含的坏用户应该越多,越靠后的等份里,包含的坏用户应该要更少。作为对比,如果不对用户评分,按照总体坏用户占比30%来算,每个等份中坏用户占比也是30%。将这两种方法的每等份坏用户占比放在一张柱状图上进行对比,就是提升图。
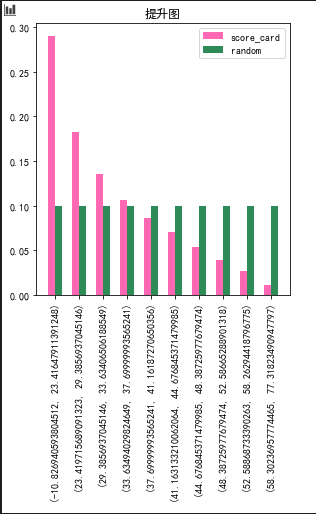
将这两种方法的累计坏用户占比放在一张曲线图上,就是洛伦兹曲线图。
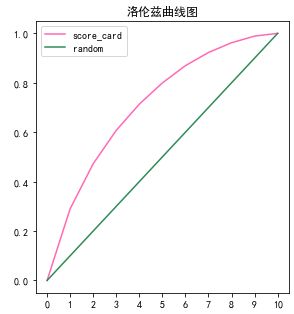
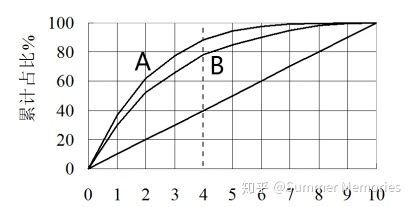
此外,洛伦兹曲线可以比较两个评分卡的优劣,例如下图中虚线对应的分数假设是600分,那么在600分这cutoff点下,A和B的拒绝率都是40%,但A可以拒绝掉88%的坏用户,B只能拒掉78%的坏用户,说明A评分卡的效果更好。
# 绘制提升图和洛伦兹曲线
def plot_lifting(df,score_col,target,bins=10,plt_size=None):
    """
    df:数据集,包含最终的得分
    score_col:最终分数的字段名
    target:目标变量名
    bins:分数划分成的等份数
    plt_size:绘图尺寸

    return:提升图和洛伦兹曲线
    """
    score_list = list(df[score_col])
    label_list = list(df[target])
    items = sorted(zip(score_list,label_list),key = lambda x:x[0])
    step = round(df.shape[0]/bins,0)
    bad = df[target].sum()
    all_badrate = float(1/bins)
    all_badrate_list = [all_badrate]*bins
    all_badrate_cum = list(np.cumsum(all_badrate_list))
    all_badrate_cum.insert(0,0)

    score_bin_list=[]
    bad_rate_list = []
    for i in range(0,bins,1):
        index_a = int(i*step)
        index_b = int((i+1)*step)
        score = [x[0] for x in items[index_a:index_b]]
        tup1 = (min(score),)
        tup2 = (max(score),)
        score_bin = tup1+tup2
        score_bin_list.append(score_bin)
        label_bin = [x[1] for x in items[index_a:index_b]]
        bin_bad = sum(label_bin)
        bin_bad_rate = bin_bad/bad
        bad_rate_list.append(bin_bad_rate)
    bad_rate_cumsum = list(np.cumsum(bad_rate_list))
    bad_rate_cumsum.insert(0,0)

    plt.figure(figsize=plt_size)
    x = score_bin_list
    y1 = bad_rate_list
    y2 = all_badrate_list
    y3 = bad_rate_cumsum
    y4 = all_badrate_cum
    plt.subplot(1,2,1)
    plt.title('提升图')
    plt.xticks(np.arange(bins)+0.15,x,rotation=90)
    bar_width= 0.3
    plt.bar(np.arange(bins),y1,width=bar_width,color='hotpink',label='score_card')
    plt.bar(np.arange(bins)+bar_width,y2,width=bar_width,color='seagreen',label='random')
    plt.legend(loc='best')
    plt.subplot(1,2,2)
    plt.title('洛伦兹曲线图')
    plt.plot(y3,color='hotpink',label='score_card')
    plt.plot(y4,color='seagreen',label='random')
    plt.xticks(np.arange(bins+1),rotation=0)
    plt.legend(loc='best')
    return plt.show()
plot_lifting(trainData,'score','y',bins=10,plt_size=(10,5))
6.设定cutoff
cutoff即根据评分划分通过/拒绝的点,其实就是看不同的阈值下混淆矩阵的情况。设定cutoff时有两个指标,一个是误伤率,即FPR,就是好客户中有多少被预测为坏客户而拒绝。另一个是拒绝率,就是这样划分的情况下有多少客户被拒绝。
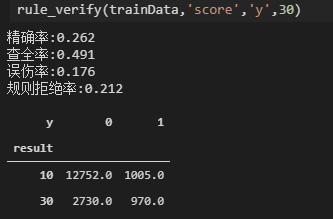
# 设定cutoff点,衡量有效性
def rule_verify(df,col_score,target,cutoff):
    """
    df:数据集
    target:目标变量的字段名
    col_score:最终得分的字段名
    cutoff :划分拒绝/通过的点

    return :混淆矩阵
    """
    df['result'] = df.apply(lambda x:30 if x[col_score]<=cutoff else 10,axis=1)
    TP = df[(df['result']==30)&(df[target]==1)].shape[0]
    FN = df[(df['result']==30)&(df[target]==0)].shape[0]
    bad = df[df[target]==1].shape[0]
    good = df[df[target]==0].shape[0]
    refuse = df[df['result']==30].shape[0]
    passed = df[df['result']==10].shape[0]

    acc = round(TP/refuse,3)
    tpr = round(TP/bad,3)
    fpr = round(FN/good,3)
    pass_rate = round(refuse/df.shape[0],3)
    matrix_df = pd.pivot_table(df,index='result',columns=target,aggfunc={col_score:pd.Series.count},values=col_score)

    print('精确率:{}'.format(acc))
    print('查全率:{}'.format(tpr))
    print('误伤率:{}'.format(fpr))
    print('规则拒绝率:{}'.format(pass_rate))
    return matrix_df
【作者】:Labryant
【原创公众号】:风控猎人
【简介】:某创业公司策略分析师,积极上进,努力提升。乾坤未定,你我都是黑马。
【转载说明】:转载请说明出处,谢谢合作!~
