python中pyecharts绘制地图(2)
pyecharts中的Map地图组件可用来地理区域的数据可视化。
1,全国地图
from pyecharts import Map


value = [155, 10, 66, 78]
attr = ["福建", "山东", "北京", "上海"]
maps = Map(
    "全国地图示例",
    title_color="#fff",
    title_pos="center",
    width=1200,
    height=600,
    background_color="#404a59",
)
maps.add("",
         attr,
         value,
         maptype='china',
         is_label_show=True,    # 地图上显示省份名称
         is_more_utils=True,
         )
maps.render(path="map.html")
结果:

2,结合VisualMap使用
from pyecharts import Map


value = [155, 10, 66, 78, 33, 80, 190, 53, 49.6, 66]
attr = [
    "福建", "山东", "北京", "上海", "甘肃", "新疆", "河南", "广西", "西藏", "内蒙古"
    ]
maps = Map(
    "全国地图 Map 结合 VisualMap示例",
    title_color="#fff",
    title_pos="center",
    width=1200,
    height=600,
    background_color="#404a59",
)

maps.add(
    "",
    attr,
    value,
    maptype="china",
    is_visualmap=True,
    visual_text_color="#000",
    visual_range=[0, 200],
    is_label_show=True,    # 地图上显示省份名称
    is_more_utils=True,
)
maps.render(path="maps.html")
结果如图:

3,广东省地图:
from pyecharts import Map


value = [20, 190, 253, 77, 65]
attr = ['汕头市', '汕尾市', '揭阳市', '阳江市', '肇庆市']
maps = Map(
    "广东地图 Map 结合 VisualMap示例",
    title_color="#fff",
    title_pos="center",
    width=1200,
    height=600,
    background_color="#404a59",
)

maps.add(
    "",
    attr,
    value,
    maptype="广东",
    is_visualmap=True,
    visual_text_color="#000",
    visual_range=[0, 300],
    is_label_show=True,
    is_map_symbol_show=True,    # 是否显示地图标记红点,默认为 True
    is_more_utils=True,
)
maps.render(path="maps.html")
结果如图:

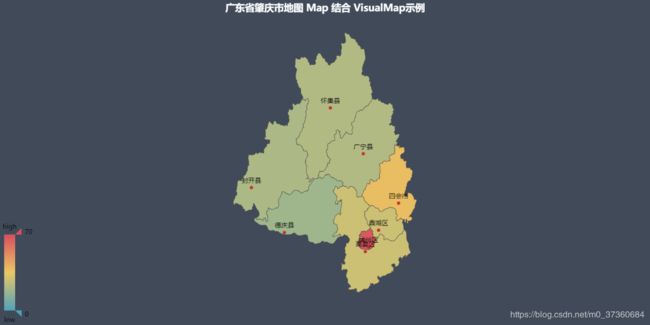
4,广东省肇庆市地图:
from pyecharts import Map


quxian_distribution = {'端州区': 67, '鼎湖区': 28, '广宁县': 22, '怀集县': 22,
                       '封开县': 21, '德庆县': 18, '高要区': 28, '四会市': 38}
quxian = list(quxian_distribution.keys())
values = list(quxian_distribution.values())

maps = Map(
    "广东省肇庆市地图 Map 结合 VisualMap示例",
    title_color="#fff",
    title_pos="center",
    width=1200,
    height=600,
    background_color="#404a59",
)

maps.add(
    "",
    quxian,
    values,
    maptype="肇庆",
    is_visualmap=True,
    visual_text_color="#000",
    visual_range=[0, 70],
    is_label_show=True,
    is_map_symbol_show=True,    # 是否显示地图标记红点,默认为 True
    is_more_utils=True,
)
maps.render(path="maps.html")
结果如图:
注意:Map中无法绘制带有涟漪特效的动态散点图。
5,设置 pieces 自定义 visualMap 组件标签
from pyecharts import Map


data = [
    ("新疆", 9), ("西藏", 12), ("内蒙古", 32), ("黑龙江", 24), ("吉林", 36), ("辽宁", 55), ("河南", 86), ("河北", 95),
    ("北京", 16), ("上海", 27), ("天津", 20), ("重庆", 49), ("四川", 56), ("云南", 66), ("广东", 73), ("福建", 55)
]
maps = Map(
    "全国主要城市空气质量",
    "data from pm2.5",
    title_color="#fff",
    title_pos="left",
    width=1200,
    height=600,
    background_color="#404a59",
)
attr, value = maps.cast(data)
maps.add(
    "",
    attr,
    value,
    maptype="china",
    is_visualmap=True,
    visual_text_color="#000",
    visual_range_text=["", ""],
    # visual_range=[0, 100],
    is_piecewise=True,
    pieces=[
        {"max": 100, "min": 70, "label": "高数值"},
        {"max": 69, "min": 30, "label": "中数值"},
        {"max": 29, "min": 0, "label": "低数值"},
    ],
    is_label_show=True,
    is_map_symbol_show=True,    # 是否显示地图标记红点,默认为 True
    is_more_utils=True,
)
maps.render(path="maps.html")
结果如图:

参考:
http://pyecharts.org/#/zh-cn/charts_base?id=map%EF%BC%88%E5%9C%B0%E5%9B%BE%EF%BC%89
https://cloud.tencent.com/developer/article/1330779