以前的一个同事告诉我说,他们公司有个需求:生成一个曲线图表,要以动画的方式画出来。曲线图很好画,动画该如何写,其实用CAShapeLayer+CABasicAnimation就可以很好的实现。
知道了技术点,剩下的就是撸代码了。
首先我们先画一个底层网格线。
新建一个AnmiationChartview继承UIView,重写drawrect:方法
-(void)drawRect:(CGRect)rect
{
// 画网格线
CGContextRef ctx = UIGraphicsGetCurrentContext();
CGContextSetLineWidth(ctx, 1);
CGContextSetStrokeColorWithColor(ctx, [UIColor greenColor].CGColor);
// 虚线设置
CGFloat a[] = {1,3};// . .
CGContextSetLineDash(ctx, 0, a, 2);
for (int i=0; i<10; i++) {
    int x = (int)CGRectGetWidth(self.bounds)/11*(i+1);
    CGMutablePathRef path = CGPathCreateMutable();
    CGPathMoveToPoint(path, NULL, 0, x);
    CGPathAddLineToPoint(path, NULL, CGRectGetWidth(self.bounds), x);
    CGContextAddPath(ctx, path);
    CGContextDrawPath(ctx, kCGPathStroke);
    CGPathRelease(path);

}
for (int j=0; j<(int)CGRectGetHeight(self.bounds)/10; j++) {
    int y = (int)CGRectGetHeight(self.bounds)/11*(j+1);
    CGMutablePathRef path = CGPathCreateMutable();
    CGPathMoveToPoint(path, NULL, y, 0);
    CGPathAddLineToPoint(path, NULL, y, CGRectGetHeight(self.bounds));
    CGContextAddPath(ctx, path);
    CGContextDrawPath(ctx, kCGPathStroke);
    CGPathRelease(path);
}
}
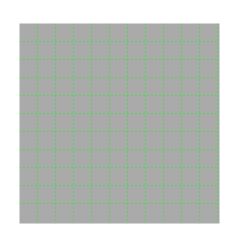
运行可以得到想要的网格线
创建一个坐标的model,用于后面传递坐标点数组
@interface ChartPoint : NSObject
@property (nonatomic,readonly)CGPoint point;
- (instancetype)initWithpoint:(CGPoint)point;
@end

@implementation ChartPoint
{
    CGPoint _chartpoint;
}
-(instancetype)initWithpoint:(CGPoint)point
{
    if (self = [super init]) {
        _chartpoint = point;
    }
    return self;
}
-(CGPoint)point
{
    return _chartpoint;
}
@end
新建ChartLayer继承CAShapeLayer
@interface ChartLayer : CAShapeLayer
- (void)showchartwithpoints:(NSArray *)ponits;
@end
当坐标点传递过来时,设置路径
CGMutablePathRef path = CGPathCreateMutable();
CGPathMoveToPoint(path, NULL, _anpoints.firstObject.point.x, _anpoints.firstObject.point.y);
for (ChartPoint *point in _anpoints) {
    if (point == _anpoints.firstObject) {

    }else{
        CGPathAddLineToPoint(path, NULL, point.point.x, point.point.y);
    }
}
self.path = path;
CGPathRelease(path);// 不要忘记release
然后 设置layer的动画
self.lineWidth=2;
self.fillColor = [UIColor clearColor].CGColor;
self.lineCap = kCALineCapRound;
self.strokeColor = [UIColor orangeColor].CGColor;
CABasicAnimation *animation = [CABasicAnimation animationWithKeyPath:@"strokeEnd"];
animation.fromValue = @(0);
animation.toValue = @(1);
animation.duration = 5;
animation.removedOnCompletion = YES;
[self addAnimation:animation forKey:@"pathanmiation"];
改变AnmiationChartview的layer为ChartLayer
 +(Class)layerClass
{
    return [ChartLayer class];
}
AnmiationChartview的调用动画方法
-(void)showchartwithpoints:(NSArray *)ponits{

    ChartLayer *layer = (ChartLayer *)self.layer;
    [layer showchartwithpoints:ponits];
}
在viewcontroller中创建View,随机获取坐标点
- (void)viewDidLoad {
    [super viewDidLoad];
    self.anv = [[AnmiationChartview alloc] initWithFrame:CGRectMake(0, 0, 200, 200)];
    self.anv.center = self.view.center;
    [self.view addSubview:self.anv];
    [self.anv setBackgroundColor:[UIColor lightGrayColor]];
}
- (void)nextChart
{
    float x,y;
    NSMutableArray *arr = [NSMutableArray     arrayWithCapacity:0];
    for (int i=0; i<40; i++) {
        x += 4.95;
        y = arc4random()%100+50;
        ChartPoint *point = [[ChartPoint alloc] initWithpoint:CGPointMake(x, y)];
        [arr addObject:point];
    }
    [self.anv showchartwithpoints:arr];
}
-(void)touchesBegan:(NSSet *)touches withEvent:(UIEvent *)event
{
    [self nextChart];
}
运行,点击一下,效果就实现了。。

