B样条曲线与贝塞尔曲线学习笔记
贝塞尔曲线
基 本 公 式 : B ( t ) = ∑ i = 0 n ( i n ) P i ( 1 − t ) n − i t i , t ∈ [ 0 , 1 ] 基本公式:B(t)=\sum_{i=0}^{n} \Big({_i^n}\Big)P_i(1-t)^{n-i}t^i,t\in[0,1] 基本公式:B(t)=i=0∑n(in)Pi(1−t)n−iti,t∈[0,1]
三次贝塞尔曲线:
B ( t ) = P 0 ( 1 − t ) 3 + 3 P 1 t ( 1 − t ) 2 + 3 P 2 t 2 ( 1 − t ) + P 3 t 3 , t ∈ [ 0 , 1 ] B(t)=P_0(1-t)^3+3P_1t(1-t)^2+3P_2t^2(1-t)+P_3t^3,t\in[0,1] B(t)=P0(1−t)3+3P1t(1−t)2+3P2t2(1−t)+P3t3,t∈[0,1]
由此可见其系数规律:
1 1 1\ 1 1 1 1 2 1 1\ 2\ 1 1 2 1 1 3 3 1 1\ 3\ 3\ 1 1 3 3 1 1 4 6 4 1 1\ 4\ 6\ 4\ 1 1 4 6 4 1
分别为一阶到四阶的系数规律,变化规律为杨辉三角,并且 t t t与 ( t − 1 ) (t-1) (t−1)的规律是一个逐渐转变的一个过程。
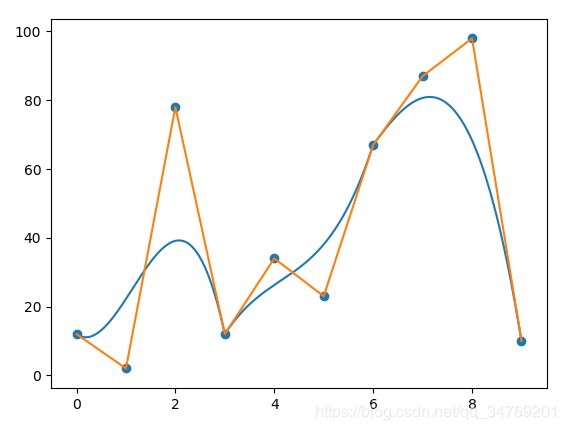
一段贝塞尔曲线拟合程序:
import matplotlib.pyplot as plt

x = [0, 1, 2, 3, 4, 5, 6, 7, 8, 9]
y = [12, 2, 78, 12, 34, 23, 67, 87, 98, 10]
xnew = []
ynew = []


def Bazier_3(m1, m2):
    for i in range(101):
        t = i / 100
        xnew.append(m1[0] * (1 - t) ** 3 + 3 * m1[1] * t * (1 - t) ** 2 + 3 * m1[2] * t ** 2 * (1 - t) + m1[3] * t ** 3)
        ynew.append(m2[0] * (1 - t) ** 3 + 3 * m2[1] * t * (1 - t) ** 2 + 3 * m2[2] * t ** 2 * (1 - t) + m2[3] * t ** 3)

for i in range(len(x) // 3):
    Bazier_3(x[i * 3:(i + 1) * 3 + 1], y[i * 3:(i + 1) * 3 + 1])

plt.plot(xnew, ynew)
plt.plot(x, y)
plt.scatter(x, y)
plt.show()
B样条曲线
基 本 公 式 : P ⃗ ( t ) = ∑ i = 0 n P i ⃗ B i , n ( t ) 基本公式:\vec{P}(t)=\sum_{i=0}^{n}\vec{P_{i}}B_{i,n}(t) 基本公式:P(t)=i=0∑nPiBi,n(t)
其基本形式与贝塞尔曲线相似
其 中 T = [ t 0 , t 1 , t 2 , . . . , t n ] 其中T=[t_{0},t_{1},t_{2},...,t_{n}] 其中T=[t0,t1,t2,...,tn]
N i , 0 ( t ) = { 1 t > t i 或 t ≥ t i + 1 0 t i ≤ t ≤ t i + 1 N_{i,0}(t)=\Big \{ ^{0\qquad\qquad t_{i}{\le}t{\le}t_{i+1}}_{1\qquad\qquad t>t_{i}或t{\ge}t_{i+1}} Ni,0(t)={1t>ti或t≥ti+10ti≤t≤ti+1
N i , k ( t ) = t − t i t i + k − t i N i , k − 1 ( t ) + t i + k + 1 − t t i + k + 1 − t i + n N i + 1 , k − 1 ( t ) k ≥ 1 N_{i,k}(t)=\frac{t-t_i}{t_{i+k}-t_i}N_{i,k-1}(t)+\frac{t_{i+k+1}-t}{t_{i+k+1}-t_{i+n}}N_{i+1,k-1}(t)\qquad k\ge1 Ni,k(t)=ti+k−tit−tiNi,k−1(t)+ti+k+1−ti+nti+k+1−tNi+1,k−1(t)k≥1
其 中 , N i , k ( t ) 中 的 i 是 控 制 点 , k 是 次 数 其中,N_{i,k}(t)中的i是控制点,k是次数 其中,Ni,k(t)中的i是控制点,k是次数
用的最多的是三次B样条曲线。
其中:
N 0 , 3 ( t ) = 1 6 ( − t 3 + 3 t 2 − 3 t + 1 ) N_{0,3}(t)=\frac{1}{6}(-t^3+3t^2-3t+1) N0,3(t)=61(−t3+3t2−3t+1)
N 1 , 3 ( t ) = 1 6 ( 3 t 3 − 6 t 2 + 4 ) N_{1,3}(t)=\frac{1}{6}(3t^3-6t^2+4) N1,3(t)=61(3t3−6t2+4)
N 2 , 3 ( t ) = 1 6 ( − 3 t 3 − 3 t 2 + 3 t + 1 ) N_{2,3}(t)=\frac{1}{6}(-3t^3-3t^2+3t+1) N2,3(t)=61(−3t3−3t2+3t+1)
N 1 , 3 ( t ) = 1 6 t 3 N_{1,3}(t)=\frac{1}{6}t^3 N1,3(t)=61t3
为了使其闭合,要取最后一个点与与第一个控制点相同,即 P m + 1 = P 0 P_{m+1}=P_0 Pm+1=P0, P m + 2 = P 1 P_{m+2}=P_1 Pm+2=P1, P m + 3 = P 2 P_{m+3}=P_2 Pm+3=P2,这样的曲线满足 c 2 c_2 c2连续。
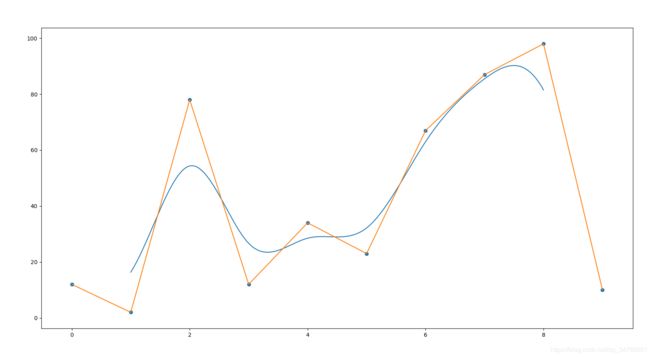
一个拼接示例:
import matplotlib.pyplot as plt

x = [0, 1, 2, 3, 4, 5, 6, 7, 8, 9]
y = [12, 2, 78, 12, 34, 23, 67, 87, 98, 10]
xnew = []
ynew = []

arg = [[-1, 3, -3, 1], [3, -6, 0, 4], [-3, 3, 3, 1], [1, 0, 0, 0]]


def Ba(t, coefficient):
    return (coefficient[0] * t ** 3 + coefficient[1] * t ** 2 + coefficient[2] * t + coefficient[3]) / 6


def creat(n):
    for i in range(101):
        t = i / 100
        xnew.append(
            x[n + 0] * Ba(t, arg[0]) + x[n + 1] * Ba(t, arg[1]) + x[n + 2] * Ba(t, arg[2]) + x[n + 3] * Ba(t, arg[3]))
        ynew.append(
            y[n + 0] * Ba(t, arg[0]) + y[n + 1] * Ba(t, arg[1]) + y[n + 2] * Ba(t, arg[2]) + y[n + 3] * Ba(t, arg[3]))


for i in range(7):
    creat(i)

plt.plot(xnew, ynew)
plt.plot(x, y)
plt.scatter(x, y)
plt.show()
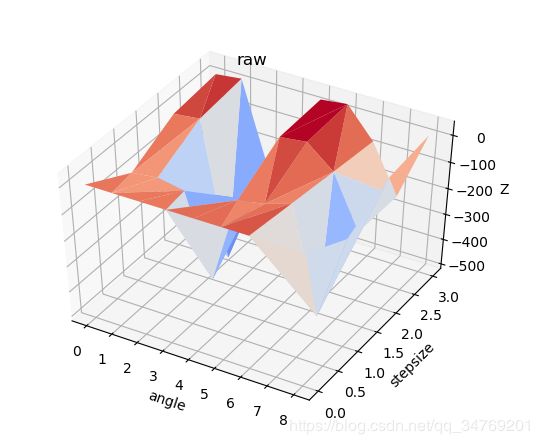
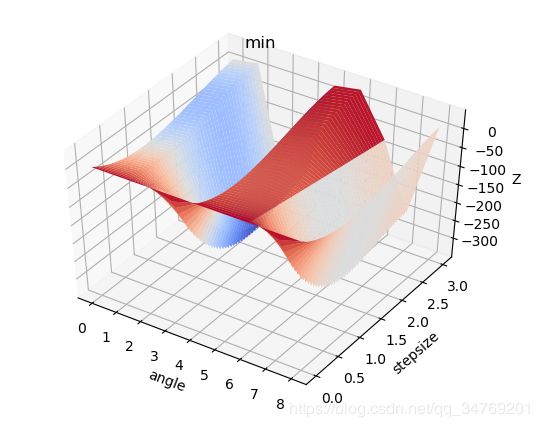
贝塞尔曲线与B样条曲线的结合:
import matplotlib.pyplot as plt
import numpy as np
from mpl_toolkits.mplot3d import Axes3D

arg = [[-1, 3, -3, 1], [3, -6, 0, 4], [-3, 3, 3, 1], [1, 0, 0, 0]]  # B样条曲线的拟合参数
mar = [[0, -93.70105743, -7.71050644, 11.30164337],
       [0, -81.51637268, 2.65858841, 21.85936928],
       [0, -100.43165588, -506.84307861, -277.47509766],
       [0, -413.89691162, -244.77906799, -228.4907074],
       [0, -74.61241913, 22.23334312, 28.80702591],
       [0, -57.65986252, 33.13808441, 40.01465988],
       [0, -23.39715576, -46.36453247, -68.40002441],
       [0, -427.99655151, -242.35075378, -246.75854492],
       [0, -93.70105743, -7.71050644, 11.30164337]]  # 原数据


def Bazier_3(m1, m2):  # 贝塞尔曲线拟合
    x = []
    y = []
    for i in range(101):
        t = i / 100
        x.append(m1[0] * (1 - t) ** 3 + 3 * m1[1] * t * (1 - t) ** 2 + 3 * m1[2] * t ** 2 * (1 - t) + m1[3] * t ** 3)
        y.append(m2[0] * (1 - t) ** 3 + 3 * m2[1] * t * (1 - t) ** 2 + 3 * m2[2] * t ** 2 * (1 - t) + m2[3] * t ** 3)
    return x, y


def Ba(t, coefficient):  # 参数合成
    return (coefficient[0] * t ** 3 + coefficient[1] * t ** 2 + coefficient[2] * t + coefficient[3]) / 6


def creat_mart(mart):  # 贝塞尔曲线生成
    re = []
    for i in range(len(mart)):
        temp_x, temp_y = Bazier_3([0, 1, 2, 3], mart[i])
        re.append(temp_y)
    return re, temp_x


def creat_mart_finnally(data):  # 最终生成
    out = []
    times = data.shape[0]
    for j in range(times - 1):
        for i in range(45):
            t = i / 45
            temp = 0
            for k in range(4):
                temp += data[(j + k) % times] * Ba(t, arg[k])
            out.append(temp)
    return out


def draw(mat1, mat2, mat3):
    x = np.linspace(0, 8, 9)
    y = np.linspace(0, 3, 4)
    x, y = np.meshgrid(x, y)
    x = x.T
    y = y.T
    xs = np.ravel(x)
    ys = np.ravel(y)
    zs = np.ravel(mat1)

    xnew = np.linspace(0, 8, 360)
    ynew = np.linspace(0, 3, 101)
    xn, yn = np.meshgrid(xnew, ynew)

    x_min = np.linspace(0, 8, 9)
    y_min = np.linspace(0, 3, 101)
    x_min, y_min = np.meshgrid(x_min, y_min)

    plt.figure("原数据")
    ax = plt.subplot(1, 1, 1, projection='3d')
    ax.plot_trisurf(xs, ys, zs, cmap='coolwarm')
    ax.set_xlabel('angle')
    ax.set_ylabel('stepsize')
    ax.set_zlabel('Z')
    plt.title('raw')

    plt.figure("最终数据")
    ax2 = plt.subplot(1, 1, 1, projection='3d')
    ax2.plot_surface(xn.T, yn.T, mat2, rstride=2, cstride=2, cmap='coolwarm', linewidth=0.5, antialiased=True)
    ax2.set_xlabel('angle')
    ax2.set_ylabel('stepsize')
    ax2.set_zlabel('Z')
    plt.title('processed')

    plt.figure("中间数据")
    ax3 = plt.subplot(1, 1, 1, projection='3d')
    ax3.plot_surface(x_min.T, y_min.T, mat3, rstride=2, cstride=2, cmap='coolwarm', linewidth=0.5, antialiased=True)
    ax3.set_xlabel('angle')
    ax3.set_ylabel('stepsize')
    ax3.set_zlabel('Z')
    plt.title('min')

    plt.show()


mat_new, _ = creat_mart(mar)

mat_new = np.array(mat_new)

mat_f = []
for i in range(mat_new.shape[1]):
    mat_f.append(creat_mart_finnally(mat_new[:, i]))

mat_f = np.array(mat_f).T

draw(np.array(mar), mat_f, mat_new)


