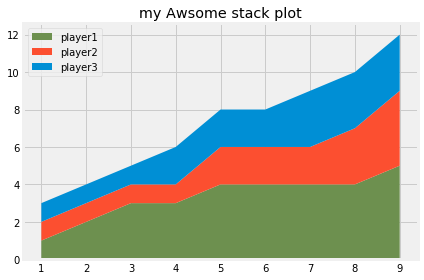
绘制堆栈图
import matplotlib.pyplot as plt
plt.style.use("fivethirtyeight")
minutes = [1, 2, 3, 4, 5, 6, 7, 8, 9]

player1 = [1, 2, 3, 3, 4, 4, 4, 4, 5]
player2 = [1, 1, 1, 1, 2, 2, 2, 3, 4]
player3 = [1, 1, 1, 2, 2, 2, 3, 3, 3]
explode = (0, 0.1, 0)
plt.pie([1, 1, 1], labels=['player1', 'player2', 'player3'], startangle=90, explode=explode)
plt.title("my Awsome stack plot")
plt.axis('equal')
plt.show()

players = ['player1', 'player2', 'player3']
colors = ['#6d904f', '#fc4f30', '#008fd5']
plt.stackplot(minutes, player1, player2, player3, labels=players, colors=colors)
plt.title("my Awsome stack plot")
plt.legend(loc='upper left')
plt.tight_layout()
plt.show()


