python 的可视化:Pyecharts VS Matplotlib
-
- Pyecharts
- 基础
- 用Pandas和Numpy
- matplotlib
- Pyecharts
以前用Python画图,一般用Matplotlib,现在我们可以用Pyecharts啦。Echarts是目前百度做的不被吐槽的几个产品之一了,Echarts有的图,Pyecharts以后都会有的。
Pyecharts
基础

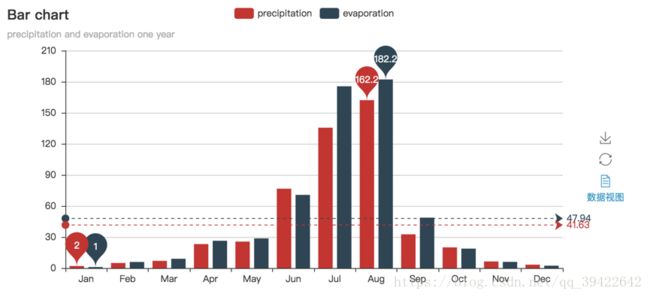
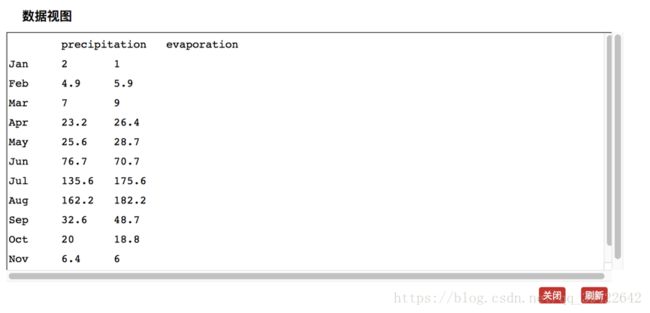
效果和在Echarts上的展示完全一样,而且,改数据还非常方便呀。看右下角的数据视图:

改源数据,只要在这里改一下数字,然后刷新一下,新的图就出来了,方便呀。
代码也很简单:
from pyecharts import Bar # 柱状图
attr = ["Jan", "Feb", "Mar", "Apr", "May", "Jun", "Jul", "Aug", "Sep", "Oct", "Nov", "Dec"]
v1 = [2.0, 4.9, 7.0, 23.2, 25.6, 76.7, 135.6, 162.2, 32.6, 20.0, 6.4, 3.3]
v2 = [2.6, 5.9, 9.0, 26.4, 28.7, 70.7, 175.6, 182.2, 48.7, 18.8, 6.0, 2.3]
bar = Bar("Bar chart", "precipitation and evaporation one year")
bar.add("precipitation", attr, v1, mark_line=["average"], mark_point=["max", "min"])
bar.add("evaporation", attr, v2, mark_line=["average"], mark_point=["max", "min"])
bar.render() # 生成一个html文件
一些关键位置的名字:
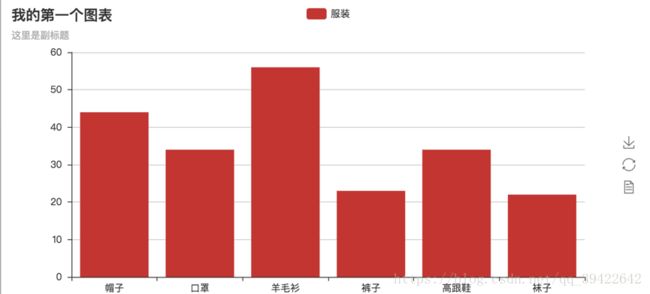
bar = Bar("我的第一个图表","这里是副标题")
bar.add("服装",["帽子","口罩","羊毛衫","裤子","高跟鞋","袜子"],[44,34,56,23,34,22]) #如果两个列表是一个字典或元祖,使用cast可以变成两个列表
bar.render()在add中加一个:is_more_utils=True,可以查看更多配置选项。
用Pandas和Numpy
import pandas as pd
import numpy as np

title = "bar chart"
index = pd.date_range("3/3/2017",periods = 6,freq = "M")
df1 = pd.DataFrame(np.random.randn(6),index = index)
df2 = pd.DataFrame(np.random.randn(6),index = index)

dtvalue1 = [i[0] for i in df1.values]
dtvalue2 = [i[0] for i in df2.values]

_index = [i for i in df1.index.format()]

bar = Bar(title, "profit and loss situation")
bar.add("profit",_index,dtvalue1,is_more_utils=True)
bar.add("loss",_index,dtvalue2,is_more_utils=True)
bar
直接把数据弄出来,然后就可以在浏览器中打开了。
matplotlib
python之matplotlib应用
参考
Pyecharts中文官网
源码

