图像分割常用算法
图像分割基础算法及实现实例
转载自http://www.elecfans.com/emb/app/20171218604957.html
图像分割就是把图像分成若干个特定的、具有独特性质的区域并提出感兴趣目标的技术和过程。它是由图像处理到图像分析的关键步骤。现有的图像分割方法主要分以下几类:
基于阈值的分割方法、基于区域的分割方法、基于边缘的分割方法以及基于特定理论的分割方法等。1998年以来,研究人员不断改进原有的图像分割方法并把其它学科的一些新理论和新方法用于图像分割,提出了不少新的分割方法。图像分割后提取出的目标可以用于图像语义识别,图像搜索等等领域。
图像分割至今尚无通用的自身理论。随着各学科许多新理论和新方法的提出,出现了许多与一些特定理论、方法相结合的图像分割方法。
图像分割基础算法及实现实例
近的项目涉及到了图像处理领域,小小研究了一番,同时收集资料实现了几个基础功能。
一、图像反转
[plain] view plain copyI=imread(‘input_image.jpg’);
J=double(I);
J=-J+(256-1); %图像反转线性变换
H=uint8(J);
subplot(3,3,4),imshow(H);
TItle(‘图像反转线性变换’);
axis([50,250,50,200]);
axis on;
二、灰度线性变换
[plain] view plain copyI=imread(‘input_image.jpg’);
subplot(3,3,1),imshow(I);
TItle(‘原始图像’);
axis([50,250,50,200]);
axis on;
I1 = rgb2gray(I);
subplot(3,3,2),imshow(I1)
TItle(‘灰度图像’)
axis([50,250,50,200]);
grid on;
axis on;
K=imadjust(I1,[0.3 0.7],[]);
subplot(3,3,3),imshow(K);
TItle(‘线性变换图像[0.3 0.7]’);
axis([50,250,20,200]);
grid on;
axis on;
三、非线性变换
[plain] view plain copyI=imread(‘input_image.jpg’);
I1 = rgb2gray(I);
subplot(3,3,5),imshow(I1);
title(‘灰度图像’);
axis([50,250,50,200]);
grid on; %显示网格线
axis on; %显示坐标系
J=double(I1);
J=40*(log(J+1));
H=uint8(J);
subplot(3,3,6),imshow(H);
title(‘对数变换图像’);
axis([50,250,50,200]);
grid on; %显示网格线
axis on; %显示坐标系
上述代码结果:
四、直方图均衡化
[plain] view plain copyI=imread(‘input_image.jpg’);
figure;
I=rgb2gray(I);
subplot(2,2,1);
imshow(I);
subplot(2,2,2);
imhist(I);
title(‘直方图均衡化图像’);
I1 = histeq(I);
subplot(2,2,3);
imshow(I1);
subplot(2,2,4);
imhist(I1);
上述代码结果:
五、线性平滑滤波器
[plain] view plain copyI=imread(‘input_image.jpg’);
figure;
subplot(231)
imshow(I)
title(‘原始图像’)
I=rgb2gray(I);
I1=imnoise(I,‘salt & pepper’,0.02);
subplot(232)
imshow(I1)
title(‘添加椒盐噪声的图像’)
k1=filter2(fspecial(‘average’,3),I1)/255; %进行3*3模板平滑滤波
k2=filter2(fspecial(‘average’,5),I1)/255; %进行5*5模板平滑滤波
k3=filter2(fspecial(‘average’,7),I1)/255; %进行7*7模板平滑滤波
k4=filter2(fspecial(‘average’,9),I1)/255; %进行9*9模板平滑滤波
subplot(233),imshow(k1);title(‘3*3模板平滑滤波’);
subplot(234),imshow(k2);title(‘5*5模板平滑滤波’);
subplot(235),imshow(k3);title(‘7*7模板平滑滤波’);
subplot(236),imshow(k4);title(‘9*9模板平滑滤波’);
上述代码结果:
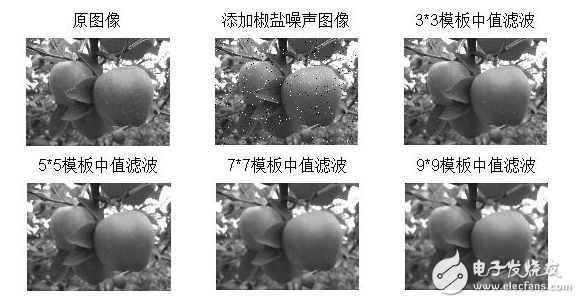
六、中值滤波器
[plain] view plain copyfigure;
I=imread(‘input_image.jpg’);
I=rgb2gray(I);
subplot(231),imshow(I);
title(‘原图像’);
J=imnoise(I,‘salt & pepper’,0.02);
subplot(232),imshow(J);
title(‘添加椒盐噪声图像’);
k1=medfilt2(J); %进行3*3模板中值滤波
k2=medfilt2(J,[5,5]); %进行5*5模板中值滤波
k3=medfilt2(J,[7,7]); %进行7*7模板中值滤波
k4=medfilt2(J,[9,9]); %进行9*9模板中值滤波
subplot(233),imshow(k1);title(‘3*3模板中值滤波’);
subplot(234),imshow(k2);title(‘5*5模板中值滤波’);
subplot(235),imshow(k3);title(‘7*7模板中值滤波’);
subplot(236),imshow(k4);title(‘9*9模板中值滤波’);
上述代码结果:
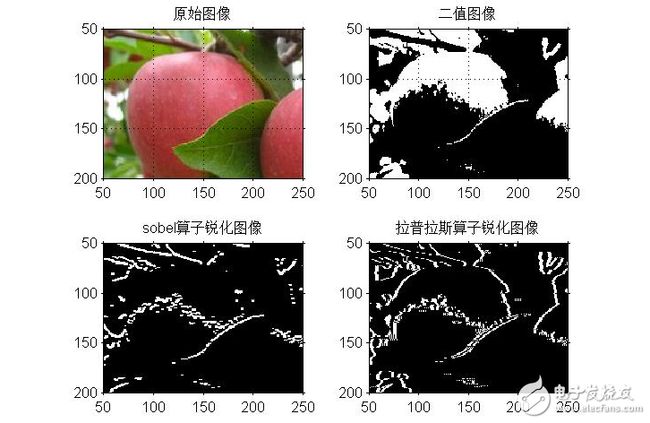
七、用Sobel算子和拉普拉斯对图像锐化
[plain] view plain copyfigure;
I=imread(‘input_image.jpg’);
subplot(2,2,1),imshow(I);
title(‘原始图像’);
axis([50,250,50,200]);
grid on; %显示网格线
axis on; %显示坐标系
I1=im2bw(I);
subplot(2,2,2),imshow(I1);
title(‘二值图像’);
axis([50,250,50,200]);
grid on; %显示网格线
axis on; %显示坐标系
H=fspecial(‘sobel’); %选择sobel算子
J=filter2(H,I1); %卷积运算
subplot(2,2,3),imshow(J);
title(‘sobel算子锐化图像’);
axis([50,250,50,200]);
grid on; %显示网格线
axis on; %显示坐标系
I1 = double(I1);
h=[0 1 0,1 -4 1,0 1 0]; %拉普拉斯算子
J1=conv2(I1,h,‘same’); %卷积运算
subplot(2,2,4),imshow(J1);
title(‘拉普拉斯算子锐化图像’);
axis([50,250,50,200]);
grid on; %显示网格线
axis on; %显示坐标系
上述代码结果:
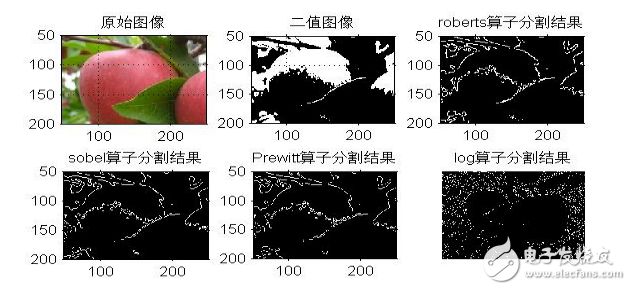
八、梯度算子检测边缘
[plain] view plain copyfigure;
I=imread(‘input_image.jpg’);
subplot(2,3,1);
imshow(I);
title(‘原始图像’);
axis([50,250,50,200]);
grid on; %显示网格线
axis on; %显示坐标系
I1=im2bw(I);
subplot(2,3,2);
imshow(I1);
title(‘二值图像’);
axis([50,250,50,200]);
grid on; %显示网格线
axis on; %显示坐标系
I2=edge(I1,‘roberts’);
subplot(2,3,3);
imshow(I2);
title(‘roberts算子分割结果’);
axis([50,250,50,200]);
grid on; %显示网格线
axis on; %显示坐标系
I3=edge(I1,‘sobel’);
subplot(2,3,4);
imshow(I3);
title(‘sobel算子分割结果’);
axis([50,250,50,200]);
grid on; %显示网格线
axis on; %显示坐标系
I4=edge(I1,‘Prewitt’);
subplot(2,3,5);
imshow(I4);
title(‘Prewitt算子分割结果’);
axis([50,250,50,200]);
grid on; %显示网格线
axis on; %显示坐标系
九、LOG算子检测边缘
[plain] view plain copyI1=rgb2gray(I);
I2=edge(I1,‘log’);
subplot(2,3,6);
imshow(I2);
title(‘log算子分割结果’);
上述代码结果:
十、Canny算子检测边缘
[plain] view plain copyfigure;
I=imread(‘input_image.jpg’);
subplot(2,2,1);
imshow(I);
title(‘原始图像’)
I1=rgb2gray(I);
subplot(2,2,2);
imshow(I1);
title(‘灰度图像’);
I2=edge(I1,‘canny’);
subplot(2,2,3);
imshow(I2);
title(‘canny算子分割结果’);
上述代码结果:
十一、边界跟踪(bwtraceboundary函数)
[plain] view plain copyI=imread(‘input_image.jpg’);
figure
subplot(2,2,1);
imshow(I);
title(‘原始图像’);
I1=rgb2gray(I); %将彩色图像转化灰度图像
threshold=graythresh(I1); %计算将灰度图像转化为二值图像所需的门限
BW=im2bw(I1, threshold); %将灰度图像转化为二值图像
subplot(2,2,2);
imshow(BW);
title(‘二值图像’);
dim=size(BW);
col=round(dim(2)/2)-90; %计算起始点列坐标
row=find(BW(:,col),1); %计算起始点行坐标
connectivity=8;
num_points=180;
contour=bwtraceboundary(BW,[row,col],‘N’,connectivity,num_points);
%提取边界
subplot(2,2,3);
imshow(I1);
hold on;
plot(contour(:,2),contour(:,1), ‘g’,‘LineWidth’ ,2);
title(‘边界跟踪图像’);
上述代码结果:
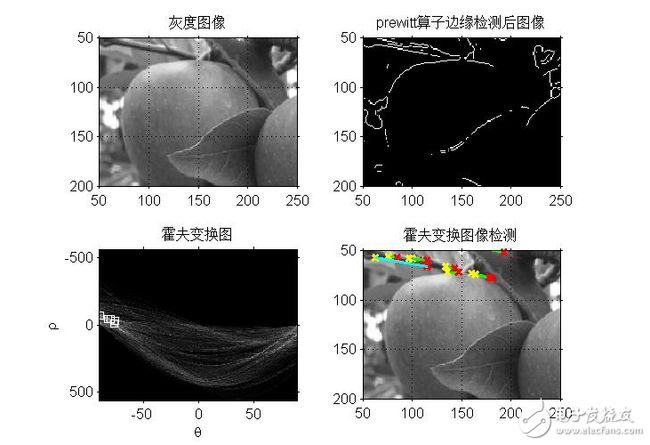
十二、Hough变换
[plain] view plain copyfigure;
I=imread(‘input_image.jpg’);
rotI=rgb2gray(I);
subplot(2,2,1);
imshow(rotI);
title(‘灰度图像’);
axis([50,250,50,200]);
grid on;
axis on;
BW=edge(rotI,‘prewitt’);
subplot(2,2,2);
imshow(BW);
title(‘prewitt算子边缘检测后图像’);
axis([50,250,50,200]);
grid on;
axis on;
[H,T,R]=hough(BW);
subplot(2,2,3);
imshow(H,[],‘XData’,T,‘YData’,R,‘InitialMagnification’,‘fit’);
title(‘霍夫变换图’);
xlabel(‘\theta’),ylabel(‘\rho’);
axis on , axis normal, hold on;
P=houghpeaks(H,5,‘threshold’,ceil(0.3*max(H(:))));
x=T(P(:,2));y=R(P(:,1));
plot(x,y,‘s’,‘color’,‘white’);
lines=houghlines(BW,T,R,P,‘FillGap’,5,‘MinLength’,7);
subplot(2,2,4);imshow(rotI);
title(‘霍夫变换图像检测’);
axis([50,250,50,200]);
grid on;
axis on;
hold on;
max_len=0;
for k=1:length(lines)
xy=[lines(k).point1;lines(k).point2];
plot(xy(:,1),xy(:,2),‘LineWidth’,2,‘Color’,‘green’);
plot(xy(1,1),xy(1,2),‘x’,‘LineWidth’,2,‘Color’,‘yellow’);
plot(xy(2,1),xy(2,2),‘x’,‘LineWidth’,2,‘Color’,‘red’);
len=norm(lines(k).point1-lines(k).point2);
if(len》max_len)
max_len=len;
xy_long=xy;
end
end
plot(xy_long(:,1),xy_long(:,2),‘LineWidth’,2,‘Color’,‘cyan’);
上述代码结果:
十三、直方图阈值法
[plain] view plain copyfigure;
I=imread(‘input_image.jpg’);
I1=rgb2gray(I);
subplot(2,2,1);
imshow(I1);
title(‘灰度图像’)
axis([50,250,50,200]);
grid on; %显示网格线
axis on; %显示坐标系
[m,n]=size(I1); %测量图像尺寸参数
GP=zeros(1,256); %预创建存放灰度出现概率的向量
for k=0:255
GP(k+1)=length(find(I1==k))/(m*n); %计算每级灰度出现的概率,将其存入GP中相应位置
end
subplot(2,2,2),bar(0:255,GP,‘g’) %绘制直方图
title(‘灰度直方图’)
xlabel(‘灰度值’)
ylabel(‘出现概率’)
I2=im2bw(I,150/255);
subplot(2,2,3),imshow(I2);
title(‘阈值150的分割图像’)
axis([50,250,50,200]);
grid on; %显示网格线
axis on; %显示坐标系
I3=im2bw(I,200/255); %
subplot(2,2,4),imshow(I3);
title(‘阈值200的分割图像’)
axis([50,250,50,200]);
grid on; %显示网格线
axis on; %显示坐标系
上述代码结果:
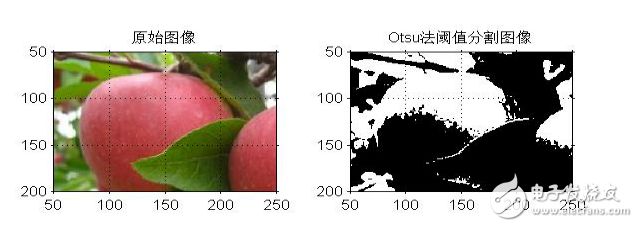
十四、自动阈值法:Otsu法
[plain] view plain copyclc
clear all
figure;
I=imread(‘input_image.jpg’);
subplot(1,2,1),imshow(I);
title(‘原始图像’)
axis([50,250,50,200]);
grid on; %显示网格线
axis on; %显示坐标系
level=graythresh(I); %确定灰度阈值
BW=im2bw(I,level);
subplot(1,2,2),imshow(BW);
title(‘Otsu法阈值分割图像’)
axis([50,250,50,200]);
grid on; %显示网格线
axis on; %显示坐标系
上述代码结果:
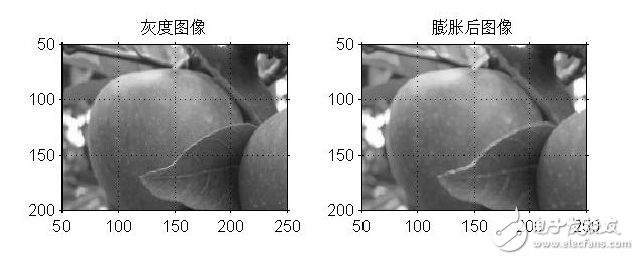
十五、膨胀操作
[plain] view plain copyfigure;
I=imread(‘input_image.jpg’);
I1=rgb2gray(I);
subplot(1,2,1);
imshow(I1);
title(‘灰度图像’)
axis([50,250,50,200]);
grid on; %显示网格线
axis on; %显示坐标系
se=strel(‘disk’,1); %生成圆形结构元素
I2=imdilate(I1,se); %用生成的结构元素对图像进行膨胀
subplot(1,2,2);
imshow(I2);
title(‘膨胀后图像’);
axis([50,250,50,200]);
grid on; %显示网格线
axis on; %显示坐标系
上述代码结果:
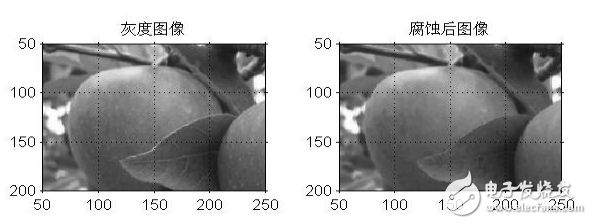
十六、腐蚀操作
[plain] view plain copyfigure;
I=imread(‘input_image.jpg’);
I1=rgb2gray(I);
subplot(1,2,1);
imshow(I1);
title(‘灰度图像’)
axis([50,250,50,200]);
grid on; %显示网格线
axis on; %显示坐标系
se=strel(‘disk’,1); %生成圆形结构元素
I2=imerode(I1,se); %用生成的结构元素对图像进行腐蚀
subplot(1,2,2);
imshow(I2);
title(‘腐蚀后图像’);
axis([50,250,50,200]);
grid on; %显示网格线
axis on; %显示坐标系
上述代码结果:
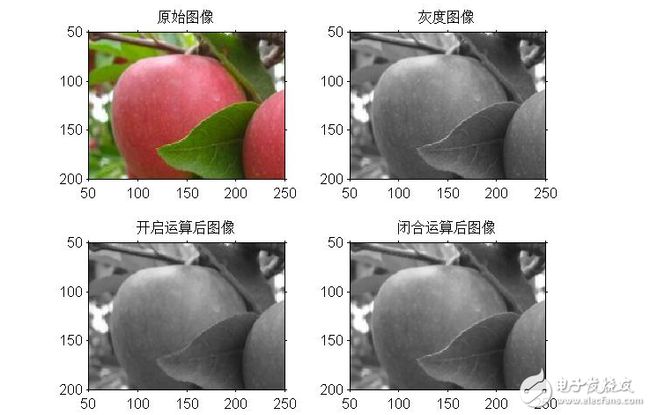
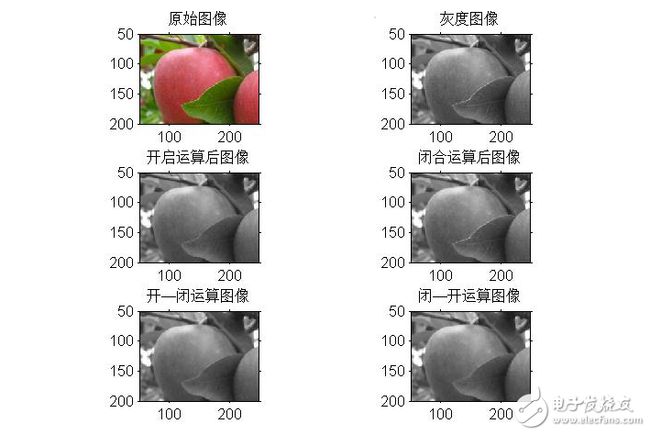
十七、开启和闭合操作
[plain] view plain copyfigure;
I=imread(‘input_image.jpg’);
subplot(2,2,1),imshow(I);
title(‘原始图像’);
axis([50,250,50,200]);
axis on; %显示坐标系
I1=rgb2gray(I);
subplot(2,2,2),imshow(I1);
title(‘灰度图像’);
axis([50,250,50,200]);
axis on; %显示坐标系
se=strel(‘disk’,1); %采用半径为1的圆作为结构元素
I2=imopen(I1,se); %开启操作
I3=imclose(I1,se); %闭合操作
subplot(2,2,3),imshow(I2);
title(‘开启运算后图像’);
axis([50,250,50,200]);
axis on; %显示坐标系
subplot(2,2,4),imshow(I3);
title(‘闭合运算后图像’);
axis([50,250,50,200]);
axis on; %显示坐标系
上述代码结果:
十八、开启和闭合组合操作
[plain] view plain copyfigure;
I=imread(‘input_image.jpg’);
subplot(3,2,1),imshow(I);
title(‘原始图像’);
axis([50,250,50,200]);
axis on; %显示坐标系
I1=rgb2gray(I);
subplot(3,2,2),imshow(I1);
title(‘灰度图像’);
axis([50,250,50,200]);
axis on; %显示坐标系
se=strel(‘disk’,1);
I2=imopen(I1,se); %开启操作
I3=imclose(I1,se); %闭合操作
subplot(3,2,3),imshow(I2);
title(‘开启运算后图像’);
axis([50,250,50,200]);
axis on; %显示坐标系
subplot(3,2,4),imshow(I3);
title(‘闭合运算后图像’);
axis([50,250,50,200]);
axis on; %显示坐标系
se=strel(‘disk’,1);
I4=imopen(I1,se);
I5=imclose(I4,se);
subplot(3,2,5),imshow(I5); %开—闭运算图像
title(‘开—闭运算图像’);
axis([50,250,50,200]);
axis on; %显示坐标系
I6=imclose(I1,se);
I7=imopen(I6,se);
subplot(3,2,6),imshow(I7); %闭—开运算图像
title(‘闭—开运算图像’);
axis([50,250,50,200]);
axis on; %显示坐标系
上述代码结果:
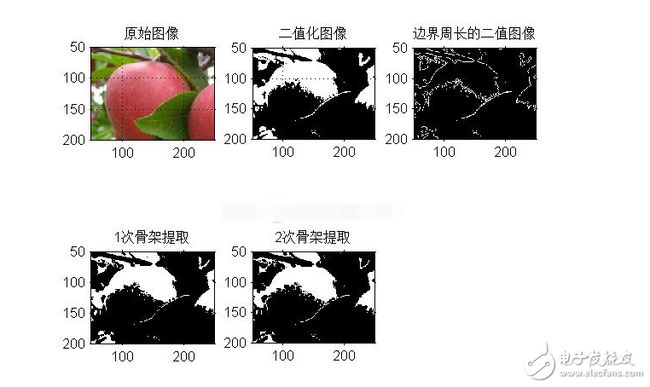
十九、形态学边界提取
[plain] view plain copyfigure;
I=imread(‘input_image.jpg’);
subplot(2,3,1),imshow(I);
title(‘原始图像’);
axis([50,250,50,200]);
grid on; %显示网格线
axis on; %显示坐标系
I1=im2bw(I);
subplot(2,3,2),imshow(I1);
title(‘二值化图像’);
axis([50,250,50,200]);
grid on; %显示网格线
axis on; %显示坐标系
I2=bwperim(I1); %获取区域的周长
subplot(2,3,3),imshow(I2);
title(‘边界周长的二值图像’);
axis([50,250,50,200]);
grid on;
axis on;
I3=bwmorph(I1,‘skel’,1);
subplot(2,3,4),imshow(I3);
title(‘1次骨架提取’);
axis([50,250,50,200]);
axis on;
I4=bwmorph(I1,‘skel’,2);
subplot(2,3,5),imshow(I4);
title(‘2次骨架提取’);
axis([50,250,50,200]);
axis on;
上述代码结果:


