R手册(Visualise)--leaflet+leafletCN
文章目录
- leaflet
- 基本用法
- Map Widget:地图控件
- Basemaps:底图
- Markers:标记
- Popups and Labels:弹出窗口和标签
- Lines and Shapes:线条和几何形状
- 其他组件
- GeoJSON and TopoJSON
- Shiny Integration
- leafletCN
- 自带地图数据(GeoJSON)
- 绘图(leaflet封装)
- 辅助函数
leaflet
Leaflet是一个用于交互式地图的开源JavaScript库。这个R包可以很容易地从R创建Leaflet地图。
语法:leaflet通过管道操作%>%叠加图层作图。
官网链接
基本用法
您使用以下基本步骤创建Leaflet地图:
- 通过
leaflet()调用创建地图小部件。 - 通过使用层功能(例如,addTiles,addMarkers,addPolygons)添加层到地图,来修改窗口小部件的地图。
- 根据需要重复步骤2。
- 打印地图小部件以显示它。
library(leaflet)
m <- leaflet() %>%
  addTiles() %>%  # Add default OpenStreetMap map tiles
  addMarkers(lng=174.768, lat=-36.852, popup="The birthplace of R")
m  # Print the map

Map Widget:地图控件
已整理的组件用法链接
Initialization (初始化)
| 函数 | 说明 |
|---|---|
| leaflet() | 标准函数 |
| center | Initial geographic center of the map |
| zoom | Initial map zoom level |
| minZoom | Minimum zoom level of themap |
| maxZoom | Maximum zoom level of thema |
leaflet(data = NULL,width = NULL, height = NULL,
  padding = 0,options = leafletOptions())
Map Methods (作图方法)
| 函数 | 说明 |
|---|---|
| setView(map,lng,lat,zoom, options = list()) ) | 设置地图视图的中心和缩放级别 |
| fitBounds(map, lng1, lat1, lng2, lat2) | 设定边界经纬度 |
| clearBounds(map) | 清除边界,从地图元素中自动设定 |
Data Object (数据对象)
leaflet()图层和map图层都有一个data参数,用来接收空间数据,data的格式如下:
- Base R : data.frame对象
 df <-data.frame(lat = ..., lng= ... )
leaflet(df) %>% addTiles() %>% addCircles()
-
sp package library(sp) Useful functions
SpatialPoints, SpatialLines, SpatialPolygons, ... -
maps package library(maps)
mapStates <-map("state", fill = TRUE, plot = FALSE)
leaflet(mapStates) %>%
  addTiles() %>%
  addPolygons(fillColor = topo.colors(10, alpha = NULL), stroke = FALSE)`
示例
library(maps)
mapStates = map("state", fill = TRUE, plot = FALSE)
leaflet(data = mapStates) %>% addTiles() %>%
  addPolygons(fillColor = topo.colors(10, alpha = NULL), stroke = FALSE)

Basemaps:底图
addTiles() 添加地图瓦片,默认OpenStreetMap图块
addProviderTiles(map, provider) 添加第三方图块
addWMSTiles() 添加WMS (Web Map Service) 图块
names(providers) : 查看所有第三方图块
参数provider = c(providers$Stamen.Toner, CartoDB.Positron, Esri.NatGeoWorldMap)

Markers:标记
接收经纬度坐标latitude/longitude ,标记出icons or circles,data数据来自向量或已赋值data.frame或sp对象。
1. Icon Markers
# 添加默认标记
addMarkers(map, lng = NULL, lat = NULL,icon = NULL,
  popup = NULL, label = NULL,clusterOptions = NULL)

#定制标记
makeIcon/icons(iconUrl, iconWidth, iconHeight, iconAnchorX, iconAnchorY, shadowUrl, shadowWidth, shadowHeight, ... )

# 创建图表列表,通过位置或名称从该列表中进行选择
iconList(icon1= makeIcon(…), icon2= makeIcon(…))

# 自定义标记
addAwesomeMarkers, makeAwesomeIcon, awesomeIcons, awesomeIconList
addMarkers()参数:
icon, popup : 点击时要显示的消息
label : 鼠标静止时显示的信息
clusterOptions = markerClusterOptions() : 大量标记时集群显示选项
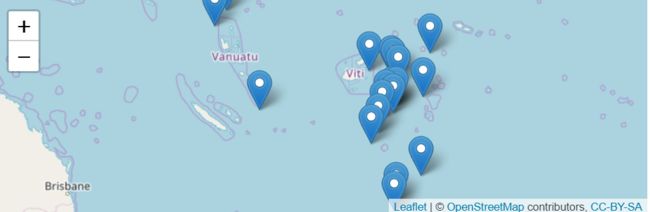
示例 1
# 默认markers
data(quakes) # Show first 20 rows from the `quakes` dataset
leaflet(data = quakes[1:20,]) %>% addTiles() %>%
  addMarkers(~long, ~lat, popup = ~as.character(mag), label = ~as.character(mag))
示例 2
quakes1 <- quakes[1:10,]

leafIcons <- icons(
  iconUrl = ifelse(quakes1$mag < 4.6,
    "http://leafletjs.com/examples/custom-icons/leaf-green.png",
    "http://leafletjs.com/examples/custom-icons/leaf-red.png"
  ),
  iconWidth = 38, iconHeight = 95,
  iconAnchorX = 22, iconAnchorY = 94,
  shadowUrl = "http://leafletjs.com/examples/custom-icons/leaf-shadow.png",
  shadowWidth = 50, shadowHeight = 64,
  shadowAnchorX = 4, shadowAnchorY = 62
)

leaflet(data = quakes1) %>% addTiles() %>%
  addMarkers(~long, ~lat, icon = leafIcons)

示例 3
leaflet(quakes) %>% addTiles() %>% addMarkers(
  clusterOptions = markerClusterOptions()
)

2. Circle Markers
addCircleMarkers(map, color, radius, stroke, opacity, ... )
#设定原标记的颜色,半径,点击,模糊度
示例 4
# Create a palette that maps factor levels to colors
pal <- colorFactor(c("navy", "red"), domain = c("ship", "pirate"))

leaflet(df) %>% addTiles() %>%
  addCircleMarkers(
    radius = ~ifelse(type == "ship", 6, 10),
    color = ~pal(type),
    stroke = FALSE, fillOpacity = 0.5
  )

Popups and Labels:弹出窗口和标签
addPopups(map, lng, lat, ...content..., options)#添加标准弹出窗口
# options = popupOptions(closeButton=FALSE)

addMarkers(..., popup, ... ) #在markers中添加窗口
addMarkers(..., label, labelOptions... ) #在markers中添加标签
# labelOptions = labelOptions(noHide,	textOnly,	textsize,	direction,	style)

addLabelOnlyMarkers() #只添加标签
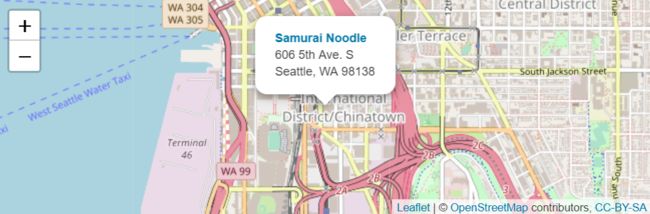
示例
content <- paste(sep = "
",
  "Samurai Noodle",
  "606 5th Ave. S",
  "Seattle, WA 98138"
)

leaflet() %>% addTiles() %>%
  addPopups(-122.327298, 47.597131, content,
    options = popupOptions(closeButton = FALSE)
  )
Lines and Shapes:线条和几何形状
Polygons and Polylines
addPolygons(map, lng = NULL, lat = NULL ,
  color = "03F", weight = 5, opacity = 0.5,    #线条颜色,粗细,不透明度
  fill = TRUE, fillColor = color, fillOpacity = 0.2,
  popup = NULL,highlightOptions,...)
# highlightOptions(color, weight=2, bringToFront=TRUE) 高亮图形
# 使用rmapshaper::ms_simplify 简化复杂的图形
Circles and Rectangles
addCircles(map,lng = NULL,lat = NULL,radius = 10,...)# 圆形,半径以米为单位
addRectangles(map, lng1, lat1, lng2, lat2,...)# 对角线参数指定矩形
示例
cities <- read.csv(textConnection("
City,Lat,Long,Pop
Boston,42.3601,-71.0589,645966
Hartford,41.7627,-72.6743,125017
New York City,40.7127,-74.0059,8406000
Philadelphia,39.9500,-75.1667,1553000
Pittsburgh,40.4397,-79.9764,305841
Providence,41.8236,-71.4222,177994
"))

leaflet(cities) %>% addTiles() %>%
  addCircles(lng = ~Long, lat = ~Lat, weight = 1,
    radius = ~sqrt(Pop) * 30, popup = ~City
  )

其他组件
| 组件 | 说明 |
|---|---|
| addLegend() | 图例 |
| addMeasure() | 测量插件 |
| addGraticule() | 网格线 |
| addTerminator() | 日夜线 |
| addMiniMap() | 迷你地图 |
GeoJSON and TopoJSON
有两种方法来使用GeoJSON/TopoJSON data
- 使用geojsonio or rgdal package 读入sp 对象
geojsonio :: geojson_read (..., what =“ sp ”)
rgdal :: readOGR (...,“ OGRGeoJSON ”) - 使用本包 addGeoJSON() and addTopoJSON() 函数
addTopoJSON / addGeoJSON (... weight , color , fill , opacity , fillOpacity ... ) - 另外的包RJSONIO and jsonlite 也能很快解析
Shiny Integration
UI 部分:leafletOutput(“name”)
server 部分:renderLeaflet(…)
渲染:renderLeaflet () 返回Leaflet map 对象
修改
| 函数举例 | 在serve中修改 |
|---|---|
| leafletProxy() | 通用修改 |
| fitBounds(0, 0, 11, 11) | 配置边界 |
| addCircles(1:10, 1:10, layerId = LETTERS[1:10]) | 添加圆形 |
| removeShape(c(“B”, “F”)) | 移除形状 |
| clearShapes() | 清除形状 |
Inputs/Events
- 对象事件
input$MAPID_OBJCATEGORY_EVENTNAME抓取事件变化的值赋给shiny变量
OBJCATEGORY: marker, shape, geojson and topojson
EVENTNAME: click, mouseover and mouseout.
所有这些事件都被设为NULL或list(lat,lng,id)(被触发时)
- 地图事件
input$MAPID_click:地图背景或basemap被敲击时提供list(lat,lng)
input$MAPID_bounds:list(north,east,south,west)
input$MAPID_zoom:zoom level
leafletCN
leafletCN是一个基于leaflet的中国扩展包, 里面保存了一些适用于中国的区域划分数据以及一些有帮助的函数, 地理区划数据来源于github的geojson-map-china项目. 数据细分到县级市.
自带地图数据(GeoJSON)
regionNames(mapName)返回地图的区域名,细分到县(world,china,city,…)
绘图(leaflet封装)
demomap (mapName) 传入地图名绘制地图,等同于(leaflet包, leaflet+addTiles +addPolygons)
示例
demomap("上海")

geojsonMap(dat, mapName) 底图+填色地图,dat赋值data.frame(regions,values)
sh = regionNames("上海")
dat = data.frame(name = sh,value = rnorm(length(sh)))
geojsonMap(dat,"上海")

辅助函数
amap(map)高德地图底图,方便leaflet包调用
read.geoShape(geojson) 读取一个geojson的对象,保存成sp对象
leafletGeo(mapName,dat = NULL) 用地图名和数据框把地图和数值组合在一起
system.file("geojson/china.json",package = "leafletCN")%>%
  read.geoShape()%>%
  plot()