吴恩达机器学习ex1的Python实现
主要根据吴恩达的机器学习视频来学习梯度下降算法,并用代码实现。
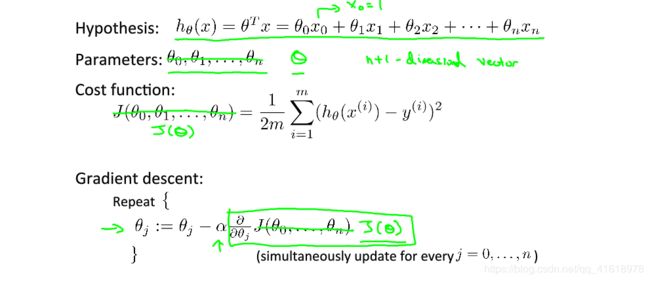
梯度下降算法的目的是求使代价函数最小的θ的值,附上相关公式。
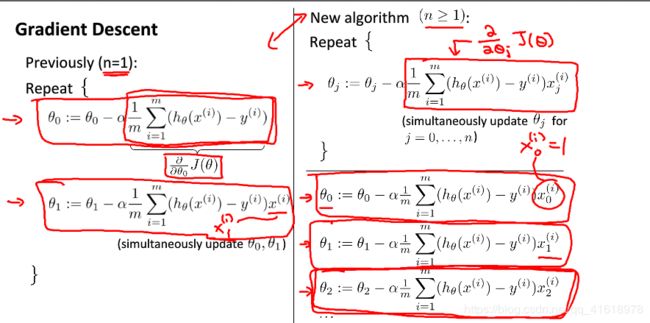
上图是假设函数和代价函数的定义,而梯度下降算法的目的就是为了找到是代价函数最小的θ值。附上梯度下降算法公式。
需要注意的时,在实现梯度下降算法时需要同时更新θ的值。
下面通过吴恩达梯度下降算法的作业和一个例子来实现该算法,验证其正确性。以下代码通过Python实现
example1
构造一个散点集合(x,y),其中x和y成线性关系y = kx + b(这里k相当于天河潭1,b相当于theta0),通过梯度下降算法来计算k的值和b的值
import numpy as np
import matplotlib.pyplot as plt
import matplotlib

def computeCost(X, y, theta):
    m = len(y)
    J = np.sum(np.square(X.dot(theta) - y)) / (2 * m)
    return J


def gradientDescent(X, y, theta, alpha, num_iters):
    m = len(y)
    J_history = np.zeros((num_iters, 1))
    temp = theta
    # temp0 = theta[0,0]
    # temp1 = theta[1,0]
    for i in range(num_iters):
        for j in range(X.shape[1]):
            temp[j,0] = theta[j,0] - alpha / m * np.sum((X.dot(theta) - y) * X[:,j].reshape(50,1))
        # 方法二
        # temp0 = theta[0,0] - alpha / m * np.sum((X.dot(theta) - y))
        # temp1 = theta[1,0] - alpha / m * np.sum((X.dot(theta) - y) * X[:,1].reshape(50,1))
        theta = temp
        # theta[0,0] = temp0
        # theta[1, 0] = temp1
        J_history[i] = computeCost(X, y, theta);

    return (theta,J_history)

#假设有50个样本
matplotlib.rcParams['font.family'] = 'SimHei'
x_data = np.random.randint(1,50,(50,1))
y = 2.5 * x_data + 3
plt.plot(x_data,y,'r*',label = '散点数据')


X = np.hstack((np.ones((50,1)),x_data))
theta = np.array([[0.],[0.]])
iterations = 10000
alpha = 0.002
#计算代价函数
J = computeCost(X, y, theta);
print('J = {:0.2f}'.format(J))
#运行梯度下降算法
theta,J_history = gradientDescent(X, y, theta, alpha, iterations);
plt.plot(x_data,x_data * theta[1,0] + theta[0,0],label = 'y=theta0 + theta1 * X')
print(theta)
plt.legend()
plt.show()
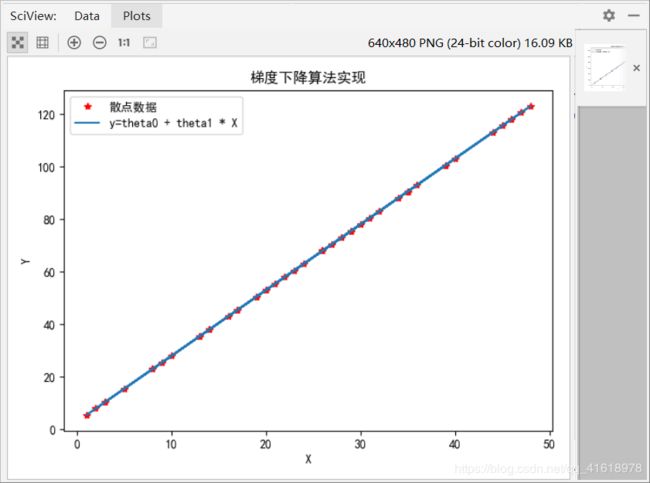
上述代码的运行结果如下:
J = 2943.36
[[2.98963149]
 [2.5002961 ]]
效果很明显,梯度下降算法能够很好的拟合散点数据,结果与预期基本一致
example2
吴恩达机器学习练习,单变量使用梯度下降算法进行数据拟合
import numpy as np
import matplotlib.pyplot as plt
import matplotlib
# 计算代价函数
def computeCost(X, y, theta):
    global  m
    J = np.sum(np.square(X.dot(theta) - y)) / (2 * m)
    return J

# 实现梯度下降算法
def gradientDescent(X, y, theta, alpha, iterations):
    global m
    temp = theta
    for iter in range(iterations):
        for i in range(X.shape[1]):
            temp[i,0] = theta[i,0] - alpha / m * (np.sum((X.dot(theta) - y) * X[:,i].reshape(m,1)))
        theta = temp
    return theta
#数据文件路径并读取文件
filepath = r'G:\MATLAB\machine-learning-ex1\ex1\ex1data1.txt'
data = np.loadtxt(filepath,delimiter=',')
#根据原始数据构造相应的矩阵
matplotlib.rcParams['font.family'] = 'Kaiti'
X = data[:,0].reshape(len(data[:,0]),1)
y = data[:,1].reshape(len(data[:,1]),1)
plt.plot(X,y,'r*',label = '原始数据')

m = len(y) #m个样本
# 根据梯度下降算法x1赋予常数1
X = np.hstack((np.ones((m,1)),X))

# 计算初始代价函数
theta = np.zeros((2,1))
J = computeCost(X, y, theta)
print('theta = [[0],[0]]时,代价函数的值是{:0.3f}'.format(J))

#运行梯度下降算法
iterations = 1500
alpha = 0.01
theta = gradientDescent(X, y, theta, alpha, iterations)
print('运行梯度下降算法后theta0 = {:0.3f},theta1 = {:0.3f}'.format(theta[0,0],theta[1,0]))
plt.plot(data[:,0],theta[1,0] * data[:,0] + theta[0,0],label = '拟合效果')
plt.legend()
plt.show()
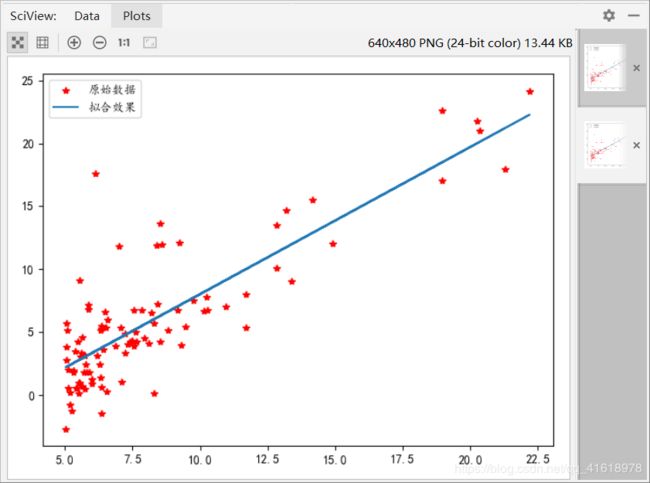
运行结果如下:
theta = [[0],[0]]时,代价函数的值是32.073
运行梯度下降算法后theta0 = -3.636,theta1 = 1.167


