Matlab基础绘图(二)
1. subplot分别显示图形
t=0:0.1:2*pi;
x=3*cos(t);
y=sin(t);
subplot(2,2,1);plot(x,y);axis normal
subplot(2,2,2);plot(x,y);axis square
subplot(2,2,3);plot(x,y);axis equal
subplot(2,2,4);plot(x,y);axis equal tight

可以对最后一个图片进行变换,
axis off,去掉坐标
box off,去掉框框的上和右
grid on,添加格子
t=0:0.1:2*pi;
x=3*cos(t);
y=sin(t);
subplot(2,2,1);plot(x,y);axis normal
subplot(2,2,2);plot(x,y);axis square
subplot(2,2,3);plot(x,y);axis equal
subplot(2,2,4);plot(x,y);axis equal tight
axis off
axis on
box off
box on
grid on
grid off

2.
图片怎么存档呢???
saveas(gcf,'
printf
3.
①获得属性:fecth properties 用get()
x=linspace(0,2*pi,1000);
y=sin(x);
plot(x,y);
h=plot(x,y);
get(h)
在命令行窗口执行这条指令,因为有了get,也就是说获得属性,那么窗口中会的自动给出所有属性
x=linspace(0,2*pi,1000);
y=sin(x);
plot(x,y);
h=plot(x,y);
get(h)
AlignVertexCenters: 'off'
Annotation: [1×1 matlab.graphics.eventdata.Annotation]
BeingDeleted: 'off'
BusyAction: 'queue'
ButtonDownFcn: ''
Children: [0×0 GraphicsPlaceholder]
Clipping: 'on'
Color: [0 0.4470 0.7410]
CreateFcn: ''
DeleteFcn: ''
DisplayName: ''
HandleVisibility: 'on'
HitTest: 'on'
Interruptible: 'on'
LineJoin: 'round'
LineStyle: '-'
LineWidth: 0.5000
Marker: 'none'
MarkerEdgeColor: 'auto'
MarkerFaceColor: 'none'
MarkerIndices: [1×1000 uint64]
MarkerSize: 6
Parent: [1×1 Axes]
PickableParts: 'visible'
Selected: 'off'
SelectionHighlight: 'on'
Tag: ''
Type: 'line'
UIContextMenu: [0×0 GraphicsPlaceholder]
UserData: []
Visible: 'on'
XData: [1×1000 double]
XDataMode: 'manual'
XDataSource: ''
YData: [1×1000 double]
YDataSource: ''
ZData: [1×0 double]
ZDataSource: ''
②修改属性:modify properties用set()
x=linspace(0,2*pi,1000);
y=sin(x);
plot(x,y);
h=plot(x,y);
set(gca,'XLim',[0,2*pi]);
set(gca,'YLim',[-1.2,1.2]);
emmm.......图片是有了一点点变化,但是并不是很明显的那种范围表示下标的改变,是图片形状的改变
这个具体怎么设置得自己摸索吧。。。呜呜呜
4. Font和Tick
x=linspace(0,2*pi,1000);
y=sin(x);
plot(x,y);
h=plot(x,y);
set(gca,'XLim',[0,2*pi]);
set(gca,'YLim',[-1.2,1.2]);
set(gca,'FontSize',25);
只是加上了一行FontSize,图片的FontSize就大很多了
原图:
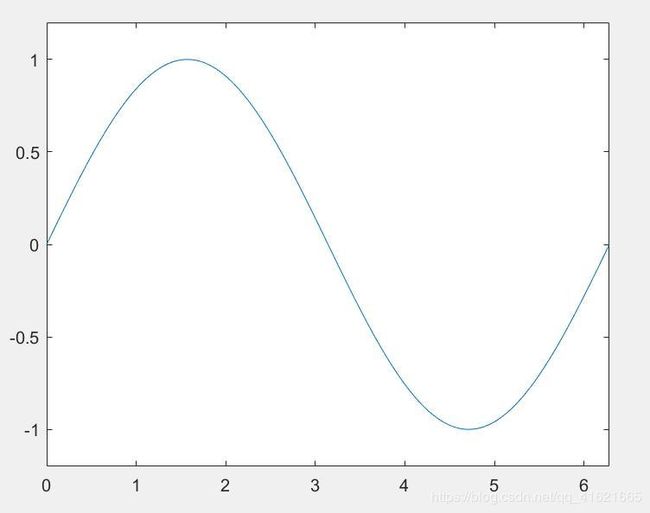
效果图:

单纯加一句set(gca,'XTick',0:pi/2:2*pi);效果为:
其实就是改变横坐标,这就是有别于set()的地方了吧
x=linspace(0,2*pi,1000);
y=sin(x);
plot(x,y);
h=plot(x,y);
set(gca,'XLim',[0,2*pi]);
set(gca,'YLim',[-1.2,1.2]);
set(gca,'FontSize',25);
set(gca,'XTick',0:pi/2:2*pi);

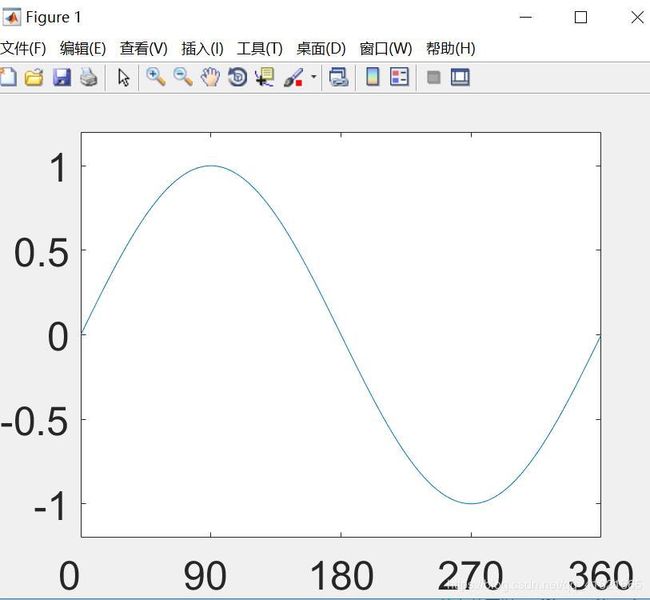
在此基础上加上set(gca,'XTickLabel',0:90:360);
横坐标就变了
x=linspace(0,2*pi,1000);
y=sin(x);
plot(x,y);
h=plot(x,y);
set(gca,'XLim',[0,2*pi]);
set(gca,'YLim',[-1.2,1.2]);
set(gca,'FontSize',25);
set(gca,'XTick',0:pi/2:2*pi);
set(gca,'XTickLabel',0:90:360);
如果想要真切的把pi表示出来,要用symbol
>> x=linspace(0,2*pi,1000);
y=sin(x);
plot(x,y);
h=plot(x,y);
set(gca,'XLim',[0,2*pi]);
set(gca,'YLim',[-1.2,1.2]);
set(gca,'FontSize',25);
set(gca,'XTick',0:pi/2:2*pi);
set(gca,'XTickLabel',0:90:360);
set(gca,'FontName','symbol');
set(gca,'XTickLabel',{'0','p/2','p','3p/2','2p'});