jupyter notebook + pyecharts 分析全球疫情【填一些坑】
一想到新冠肺炎,搞得我现在还没开学,我心态就炸了,从来没有如此想要开学的念头,在家真的闲出蛋来了,体重也飙涨,真是*****它****

目前中国通过全国人民共同努力,情况基本控制下来,在此向那些抗战在一线的人民英雄致敬,你们辛苦了
令人没想到的是,这病毒在全世界开始蔓延起来,哎,阿门,我好像也没什么为他们做的,就爬取全球数据,在心里默默的为他们祈祷
好了,进入正题
1.爬虫-获取数据
import re
from bs4 import BeautifulSoup
import requests
import json
import csv

url = 'https://3g.dxy.cn/newh5/view/pneumonia_peopleapp'
response = requests.get(url = url)
response.encoding = 'utf-8'

bs = BeautifulSoup(response.text,'lxml')
# 国内疫情数据
str1 = bs.body.text
info = re.findall(r'try(.*?)catch',str1)

# 全球数据
world = info[0]
world = world.replace(' { window.getListByCountryTypeService2true = ','')[:-1]
# print(world)

# json 数据转换为 python 对象
world_list =json.loads(world)
# print(world_list)

# 写入 csv 文件
with open('world_info.csv','w',encoding='utf-8') as fp:
    fieldnames = ['洲','国家','英文名','当前确诊','累计确诊','治愈人数','死亡人数','死亡率','历史数据']
    writer = csv.DictWriter(fp,fieldnames=fieldnames)
    writer.writeheader()

    # 遍历数据
    for item in world_list:
        # 创建一个字典
        dic = {'洲':item['continents'],'国家':item['provinceName'],'英文名':item['countryFullName'],'当前确诊':item['currentConfirmedCount'],'累计确诊':item['confirmedCount'],'治愈人数':item['curedCount'],'死亡人数':item['deadCount'],'死亡率':item['deadRate'],'历史数据':item['statisticsData']}
        writer.writerow(dic)
这里我只是拿取了各个国家的当前得数据,如果想要获取各省的数据可自行获取,从网页源代码把数据解析出来即可,这里我也把它存储到了csv文件中
2.分析数据
我的目的是在jupyter notebook + pyecharts 上分析,然后画出世界地图,因为没怎么接触过数据可视化,本来以为很简单,我***,但是搞了我好久,有好多坑,也是写这篇文章的原因,【大佬勿喷,我是小白】
- 第一个坑
pyecharts V0.5 和 V1.0之间不兼容,方法的调用,方法的导入都不一样了,我擦,我好像找的别人的代码是V0.5的,而我安装的是最新版本,这搞了我一会儿,靠度娘解决了
V0.5版本导入
from pyecharts import Geo
from pyecharts import Map
V1.0版本导入
from pyecharts.charts import Map,Geo
from pyecharts import options as opts
这里附上文档地址 pyecharts
- 第二个坑
代码写好之后,但是不显示,我擦,我****,于是又是浏览器各种搜
全球国家地图: echarts-countries-pypkg (1.9MB)
全球城市地图:echarts-cities-pypkg ( 138,398 个城市地理坐标,覆盖了200 多个国家)
中国省级地图: echarts-china-provinces-pypkg (730KB)
中国市级地图: echarts-china-cities-pypkg (3.8MB)
pip install echarts-countries-pypkg;
pip install echarts-cities-pypkg
pip install echarts-china-provinces-pypkg
pip install echarts-china-cities-pypkg
pip install echarts-china-misc-pypkg
pip install echarts-united-kingdom-pypkg
注意: 这里好像在安装这个 echarts-countries-pypkg 库的时候,报了一个error,好像他需要 pyecharts-jupyter-installer什么,我就按他提示装了,所以后来在jupyter 可以正常显示,但是好多人说不能在jupyter notebook中显示,不知是不是这里的原因,我也不晓得

- 第三个坑
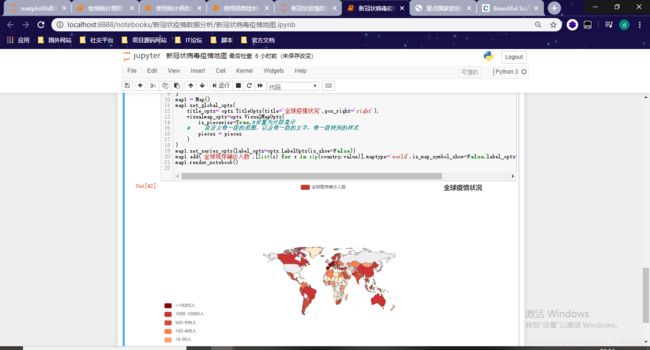
map1.render_notebook() #在jupyter notebook显示

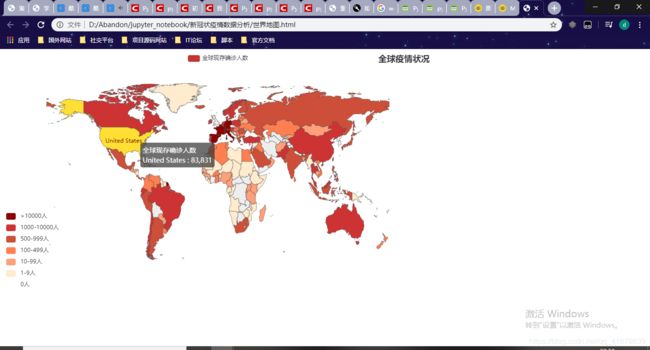
map1.render(path=“D:/Abandon/jupyter_notebook/新冠状疫情数据分析/世界地图1.html”) #这是生成一个单独的html页面

代码如下
# 绘制地图
from pyecharts.charts import Map,Geo
from pyecharts import options as opts
from pyecharts.globals import ThemeType #主题
from matplotlib import pyplot as plt
import pandas as pd
# 解决中文问题
plt.rcParams['font.sans-serif'] = ['SimHei']
# 直接显示生成图表
# %matplotlib inline

data = pd.read_csv('D:/Abandon/jupyter_notebook/新冠状疫情数据分析/world_info.csv')

country = list(data['英文名'])
value = list(data['当前确诊'])
pieces=[
{"max":0,"label":"0人","color":"#FFFFFF"},
{"min":1,"max":9,"label":"1-9人","color":"#FFEBCD"},
{"min":10,"max":99,"label":"10-99人","color":"#FFA07A"},
{"min":100,"max":499,"label":"100-499人","color":"#FF7F50"},
{"min":500,"max":999,"label":"500-999人","color":"#CD4F39"},
{'min':1000,"max":10000,"label":"1000-10000人","color":"#CD3333"},
{'min':10000,"label":">10000人","color":"#8B0000"}  #不指定 max,表示 max 为无限大
]
map1 = Map()
map1.set_global_opts(
    title_opts= opts.TitleOpts(title='全球疫情状况',pos_right='right'),
    visualmap_opts=opts.VisualMapOpts(
        is_piecewise=True,#设置为分段显示
    #     自定义每一段的范围,以及每一段的文字,每一段特别的样式
        pieces = pieces
    )
)
map1.set_series_opts(label_opts=opts.LabelOpts(is_show=False))
map1.add('全球现存确诊人数',[list(z) for z in zip(country,value)],maptype='world',is_map_symbol_show=False,label_opts=opts.LabelOpts(is_show=False))
# map1.render_notebook()
map1.render(path="D:/Abandon/jupyter_notebook/新冠状疫情数据分析/世界地图1.html")

