python绘制数据可视化图(seaborn+numpy+pandas+matplotlib)
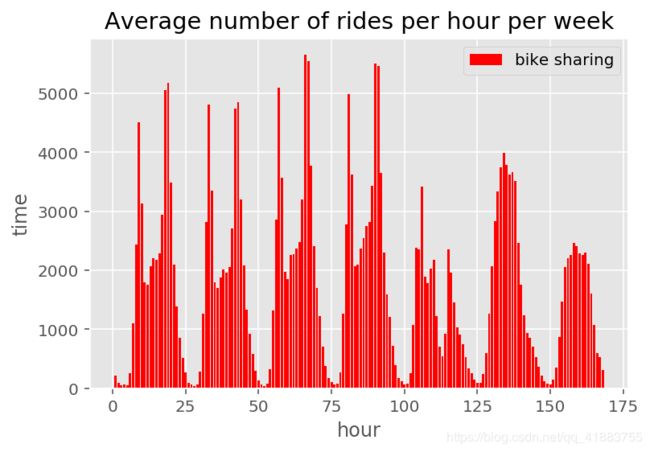
通过简单的matlplotlib第三方库,导入你的数据进行绘制柱状图。## 柱状图
import matplotlib.pyplot as plt
import string
plt.xlabel('hour')
plt.ylabel('time')
plt.title('Average number of rides per hour per week')

xx = []#存放X值
yy = []


def savey(str1):
    fx=open("f://"+str1,"r").read().split("\n")
    ax=[]
    x=[]
    s=0
    i=0
    for i in range(len(fx)):
        s=float(fx[i])
        ax.append(s)
    x=ax
    return x

def savex(str1):
    fx=open("f://"+str1,"r").read().split("\n")
    ax=[]
    x=[]
    s=0
    i=0
    for i in range(len(fx)):
        s=int(fx[i])
        ax.append(s)
    x=ax
    return x
xx=savex("datax.txt")
yy=savex("datay.txt")
plt.bar(xx,yy,label='bike sharing',color='r')

plt.legend()
plt.show()
绘制折线图
通过plot函数,可以绘制多条折线。
import matplotlib.pyplot as plt
def savex(str1):
    fx=open("f://"+str1,"r").read().split("\n")
    ax=[]
    x=[]
    s=0
    i=0
    for i in range(len(fx)):
        s=float(fx[i])
        ax.append(s)
    x=ax
    return x
#x=[2013,2014,2015,2016,2017,2018]
x=savex("datax.txt")
y1=savex("data_50.txt")
y2=savex("data_60.txt")
y3=savex("data_70.txt")
y4=savex("data_80.txt")
y5=savex("data_90.txt")
plt.plot(x,y1,label="1950",color='r')
plt.plot(x,y2,label="1960",color='g')
plt.plot(x,y3,label="1970",color='b')
plt.plot(x,y4,label="1980",color='y')
plt.plot(x,y5,label="1990",color='black')
#plt.plot(x2,y2,label='Second one')
plt.xlabel('Month')
plt.ylabel("People")
plt.title('People Monthly active membership in 2015.1~2017.12')
plt.legend()
plt.show()
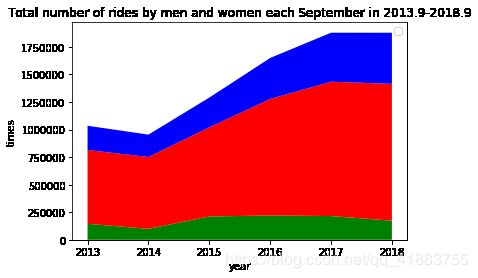
山脉图
import matplotlib.pyplot as plt
y0=[145227,99538,211741,220121,215442,173487]
y1=[669732,651493,808558,1057055,1218525,1240965]
y2=[219400,202856,269400,371680,444132,463433]
x=[2013,2014,2015,2016,2017,2018]
plt.stackplot(x,y0,y1,y2,colors = [‘g’,‘r’,‘b’])
plt.xlabel(‘year’)
plt.ylabel(‘times’)
plt.title(‘Total number of rides by men and women each September in 2013.9-2018.9’)
plt.legend()
plt.show()

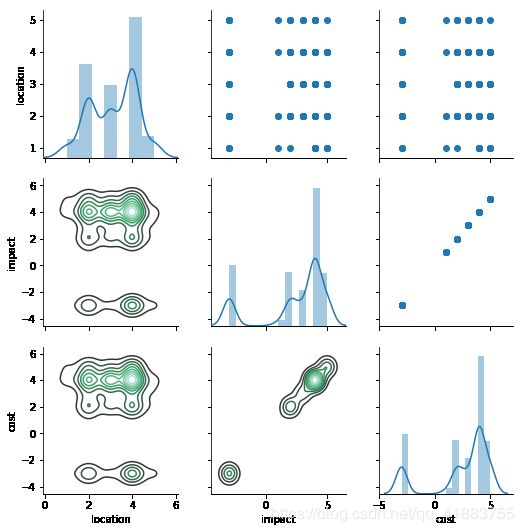
Seaborn库绘制多变量图
通过用pairgrid()和map()函数可以生成多种可视化图。
import numpy as np
import pandas as pd
import matplotlib.pyplot as plt
import seaborn as sns
%matplotlib inline
data = pd.read_excel('d:\\num.xls',sheet_name='Sheet1')
data1=data["location"]
data2=data["cost"]
data3=data["impact"]
a=pd.DataFrame({'location':data1,"impact":data3,"cost":data3})
g = sns.PairGrid(a)
g.map_diag(sns.distplot)
g.map_upper(plt.scatter)
g.map_lower(sns.kdeplot)
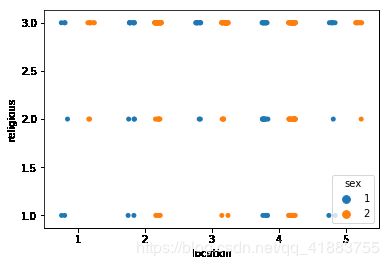
Seaborn多变量散点图
import numpy as np
import pandas as pd
import matplotlib.pyplot as plt
import seaborn as sns
%matplotlib inline
tips = pd.read_excel('d:\\num.xls',sheet_name='Sheet1')
sns.stripplot(x = 'location', y = 'religious', data = tips, jitter= True,hue = 'sex', dodge = True)

sns.set()

# Load the brain networks example dataset
df = sns.load_dataset("brain_networks", header=[0, 1, 2], index_col=0)

# Select a subset of the networks
used_networks = [1, 5, 6, 7, 8, 12, 13, 17]
used_columns = (df.columns.get_level_values("network")
                          .astype(int)
                          .isin(used_networks))
df = df.loc[:, used_columns]

# Create a categorical palette to identify the networks
network_pal = sns.husl_palette(8, s=.45)
network_lut = dict(zip(map(str, used_networks), network_pal))

# Convert the palette to vectors that will be drawn on the side of the matrix
networks = df.columns.get_level_values("network")
network_colors = pd.Series(networks, index=df.columns).map(network_lut)

# Draw the full plot
sns.clustermap(df.corr(), center=0, cmap="vlag",
               row_colors=network_colors, col_colors=network_colors,
               linewidths=.75, figsize=(13, 13))


