爬取电影《无双》影评数据,分析,可视化
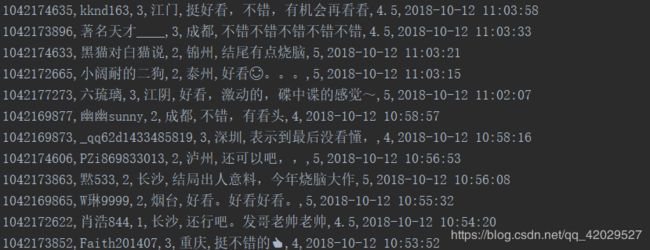
一,爬取和存储影评数据
import requests
import json
import time
import random
import csv
from datetime import datetime, timedelta


def get_headers():
    user_agent_list = [
        "Mozilla/5.0 (Windows NT 6.1; WOW64) AppleWebKit/537.1 (KHTML, like Gecko) Chrome/22.0.1207.1 Safari/537.1",
        "Mozilla/5.0 (Windows NT 6.1; WOW64) AppleWebKit/536.6 (KHTML, like Gecko) Chrome/20.0.1092.0 Safari/536.6",
        "Mozilla/5.0 (Windows NT 6.2) AppleWebKit/536.6 (KHTML, like Gecko) Chrome/20.0.1090.0 Safari/536.6",
        "Mozilla/5.0 (Windows NT 6.2; WOW64) AppleWebKit/537.1 (KHTML, like Gecko) Chrome/19.77.34.5 Safari/537.1",
        "Mozilla/5.0 (X11; Linux x86_64) AppleWebKit/536.5 (KHTML, like Gecko) Chrome/19.0.1084.9 Safari/536.5",
        "Mozilla/5.0 (Windows NT 6.0) AppleWebKit/536.5 (KHTML, like Gecko) Chrome/19.0.1084.36 Safari/536.5",
        "Mozilla/5.0 (Windows NT 6.1; WOW64) AppleWebKit/536.3 (KHTML, like Gecko) Chrome/19.0.1063.0 Safari/536.3",
        "Mozilla/5.0 (Windows NT 5.1) AppleWebKit/536.3 (KHTML, like Gecko) Chrome/19.0.1063.0 Safari/536.3",
        "Mozilla/5.0 (Windows NT 6.2) AppleWebKit/536.3 (KHTML, like Gecko) Chrome/19.0.1062.0 Safari/536.3",
        "Mozilla/5.0 (Windows NT 6.1; WOW64) AppleWebKit/536.3 (KHTML, like Gecko) Chrome/19.0.1062.0 Safari/536.3",
        "Mozilla/5.0 (Windows NT 6.2) AppleWebKit/536.3 (KHTML, like Gecko) Chrome/19.0.1061.1 Safari/536.3",
        "Mozilla/5.0 (Windows NT 6.1; WOW64) AppleWebKit/536.3 (KHTML, like Gecko) Chrome/19.0.1061.1 Safari/536.3",
        "Mozilla/5.0 (Windows NT 6.1) AppleWebKit/536.3 (KHTML, like Gecko) Chrome/19.0.1061.1 Safari/536.3",
        "Mozilla/5.0 (Windows NT 6.2) AppleWebKit/536.3 (KHTML, like Gecko) Chrome/19.0.1061.0 Safari/536.3",
        "Mozilla/5.0 (X11; Linux x86_64) AppleWebKit/535.24 (KHTML, like Gecko) Chrome/19.0.1055.1 Safari/535.24",
        "Mozilla/5.0 (Windows NT 6.2; WOW64) AppleWebKit/535.24 (KHTML, like Gecko) Chrome/19.0.1055.1 Safari/535.24"
    ]
    user_agent = random.choice(user_agent_list)
    headers = {'User-Agent': user_agent}
    return headers


def get_data(url):
    headers = get_headers()
    try:
        with requests.Session() as s:
            response = s.get(url, headers=headers, timeout=3)
            content = response.text
            return content

    except Exception as e:
        print(e)


# 处理数据
def parse_data(html):
    try:
        data = json.loads(html)['cmts']  # 将str转换为json
    except Exception as e:
        return None

    comments = []
    for item in data:
        comment = [item['id'], item['nickName'], item["userLevel"], item['cityName'] if 'cityName' in item else '',
                   item['content'].replace('\n', ' '), item['score'], item['startTime']]
        comments.append(comment)
    return comments


# 存储数据
def save_to_csv():
    start_time = datetime.now().strftime('%Y-%m-%d %H:%M:%S')  # 获取当前时间,从当前时间向前获取

    end_time = '2018-09-30 00:00:00'  # 影片的上映日期

    while start_time > end_time:  # 如果时间开始时间大于结束时间

        url = 'http://m.maoyan.com/mmdb/comments/movie/342166.json?_v_=yes&offset=0&startTime=' + start_time.replace(
            ' ', '%20')
        html = None

        try:
            html = get_data(url)

        except Exception as e:

            time.sleep(0.5)
            html = get_data(url)

        else:
            time.sleep(1)

        comments = parse_data(html)

        if comments:
            start_time = comments[14][-1]  # 获得末尾评论的时间
            start_time = datetime.strptime(start_time, '%Y-%m-%d %H:%M:%S') + timedelta(
                seconds=-1)  # 转换为datetime类型,减1秒,避免获取到重复数据
            start_time = datetime.strftime(start_time, '%Y-%m-%d %H:%M:%S')  # 转换为str

            print(comments)

            with open("comments.csv", "a", encoding='utf-8', newline='') as csvfile:
                writer = csv.writer(csvfile)

                writer.writerows(comments)


if __name__ == '__main__':
    save_to_csv()
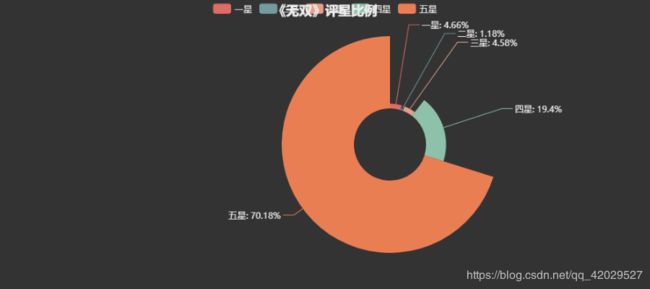
二,评星饼状图
import pandas as pd
from pyecharts import Pie  # 导入Pie组件,用于生成饼图

# pandas读取数据
df = pd.read_csv("comments.csv", names=["id", "nickName", "userLevel", "cityName", "content", "score", "startTime"])

attr = ["一星", "二星", "三星", "四星", "五星"]
score = df.groupby("score").size()  # 分组求和

value = [
    score.iloc[0] + score.iloc[1] + score.iloc[1],
    score.iloc[3] + score.iloc[4],
    score.iloc[5] + score.iloc[6],
    score.iloc[7] + score.iloc[8],
    score.iloc[9] + score.iloc[10],
]

pie = Pie('《无双》评星比例', title_pos='center', width=900)
pie.use_theme("dark")
pie.add("评分", attr, value, center=[60, 50], radius=[25, 75], rosetype='raea', is_legend_show=True, is_label_show=True)
pie.render('评星.html')
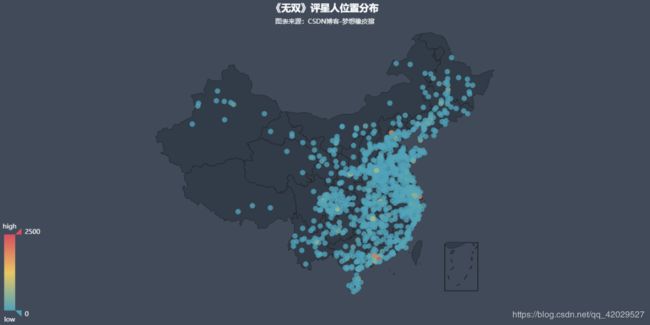
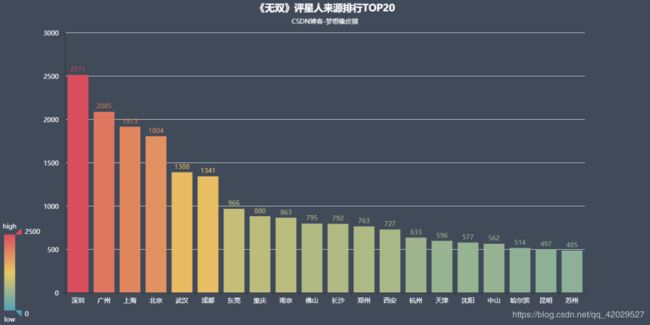
三,评星人位置分布
import json
import pandas as pd
from pyecharts import Style  # 导入Style类,用于定义样式风格
from pyecharts import Geo  # 导入Geo组件,用于生成地理坐标类图
from pyecharts import Bar # 导入Geo组件,用于生成柱状图
df = pd.read_csv("comments.csv", names=["id", "nickName", "userLevel", "cityName", "content", "score", "startTime"])


# 处理地名数据,解决坐标文件中找不到地名的问题
def handle(cities):
    cities = cities.tolist()

    # 获取坐标文件中所有地名
    data = None
    with open(
            '....找到自己电脑的文件路径....\\datasets\\city_coordinates.json',
            mode='r', encoding='utf-8') as f:
        data = json.loads(f.read())  # 将str转换为json

    # # 循环判断处理
    data_new = data.copy()  # 拷贝所有地名数据
    for city in set(cities):  # 使用set去重
        # 处理地名为空的数据
        if city == '':
            while city in cities:
                cities.remove(city)

        count = 0
        for k in data.keys():
            count += 1
            if k == city:
                break
            if k.startswith(city):  # 处理简写的地名,如 万宁市 简写为 万宁
                # print(k, city)
                data_new[city] = data[k]
                break
            if k.startswith(city[0:-1]) and len(city) >= 3:  # 查找包含关系的关键字等
                data_new[city] = data[k]
                break

        # 处理不存在的地名
        if count == len(data):
            while city in cities:
                cities.remove(city)

    # 写入覆盖坐标文件
    with open(
            '....找到自己电脑的文件路径....\\datasets\\city_coordinates.json',
            mode='w', encoding='utf-8') as f:
        f.write(json.dumps(data_new, ensure_ascii=False))  # 将json转换为str

    return cities  # 把city返回


# 生成效果图
def render():
    city_counts = df.groupby("cityName").size()
    new_citys = handle(city_counts.index)

    tuple_city = list(city_counts.items())

    attr_values = []
    for item in tuple_city:
        # print(item[0],end=' ')
        if item[0] in new_citys:
            attr_values.append(item)

    # 定义样式
    style = Style(
        title_color='#fff',
        title_pos='center',
        width=1200,
        height=600,
        background_color='#404a59',
        subtitle_color='#fff'
    )
    #
    # 根据城市数据生成地理坐标图
    geo = Geo('《无双》评星人位置分布', '图表来源:CSDN博客-梦想橡皮擦', **style.init_style)
    attr, value = geo.cast(attr_values)

    geo.add('', attr, value, visual_range=[0, 2500], type="scatter",
            visual_text_color='#fff', symbol_size=10,
            is_visualmap=True, visual_split_number=10)
    geo.render('评星人位置分布-地理坐标图.html')

    # 根据城市数据生成柱状图

    city_sorted = city_counts.sort_values(ascending=False).head(20)

    bar = Bar("《无双》评星人来源排行TOP20", "CSDN博客-梦想橡皮擦", **style.init_style)
    attr, value = bar.cast(list(city_sorted.items()))
    bar.add("", attr, value, is_visualmap=True, visual_range=[0, 2500], visual_text_color='#fff', label_color='#fff',
            xaxis_label_textcolor='#fff', yaxis_label_textcolor='#fff', is_more_utils=True,
            is_label_show=True)
    bar.render("评星人来源排行-柱状图.html")


if __name__ == '__main__':
    render()


