数据可视化(二):犯罪案件分析
犯罪庭审案件分析
所有图片点击可查看大图
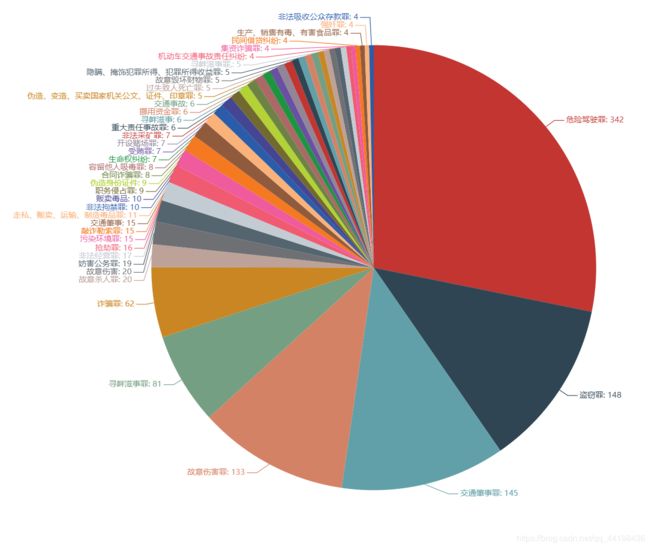
案件类型排名前40:
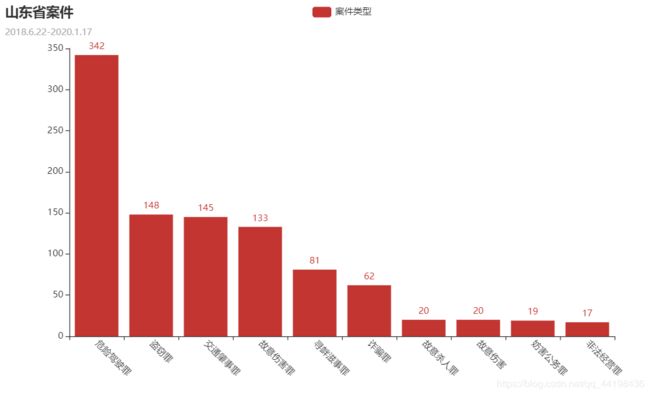
案件类型排名前10:
- 交通方面是当下犯罪最高的案件,一年内有342件案件是危险驾驶罪
- 盗窃罪紧跟其后,有148件案件
- 诈骗罪也是高发生率案件
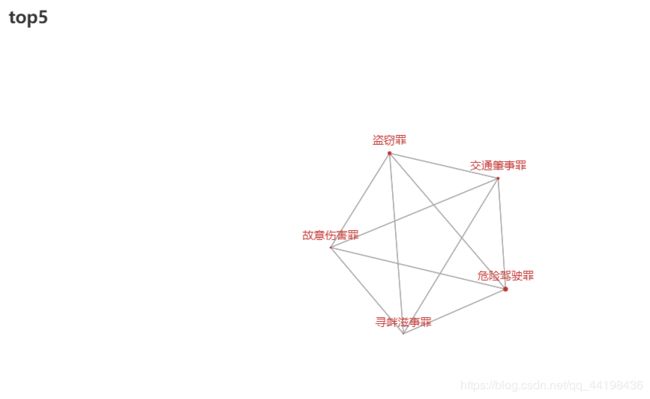
案件类型排名前5:
发生率较低案件:
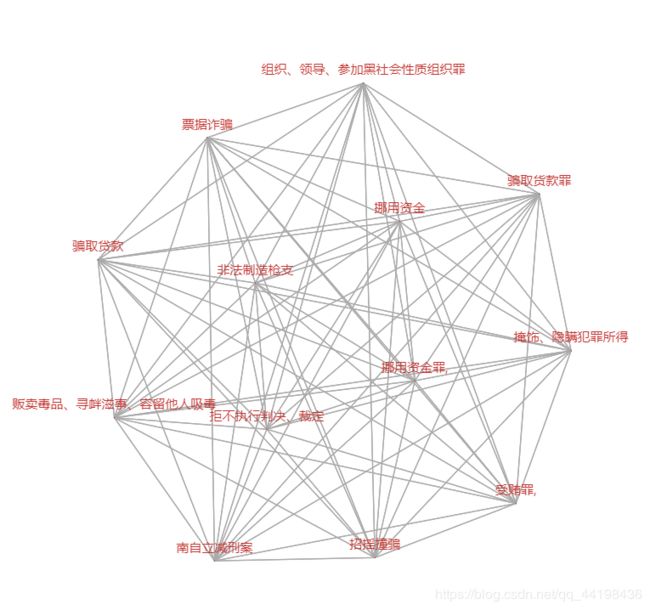
提取了1年内仅发生一次的案件,以上犯罪名目在山东省发生概率最小
所有案件类型词云:
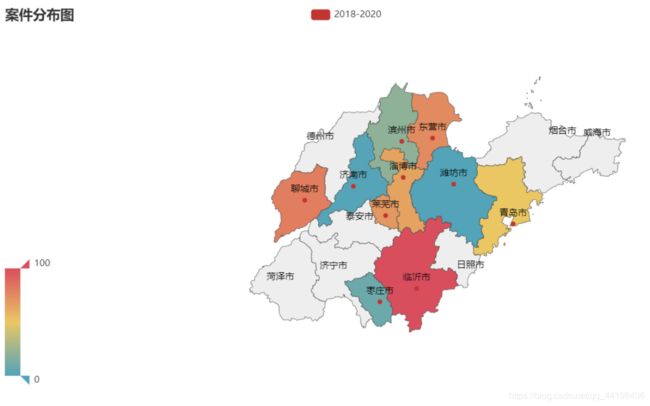
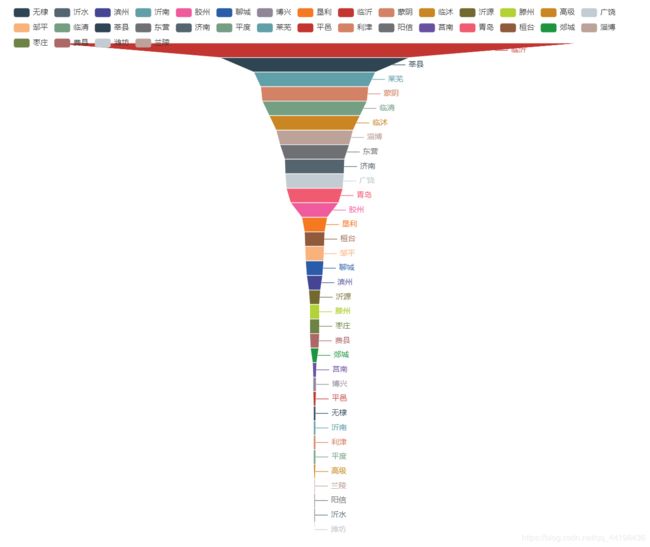
各地区受理案件数量:
各案件具体分布:
- 部分基层人民法院案件归档于中级人民法院
注:地区受理案件不一定为当地案件,数据仅作象征性排序显示
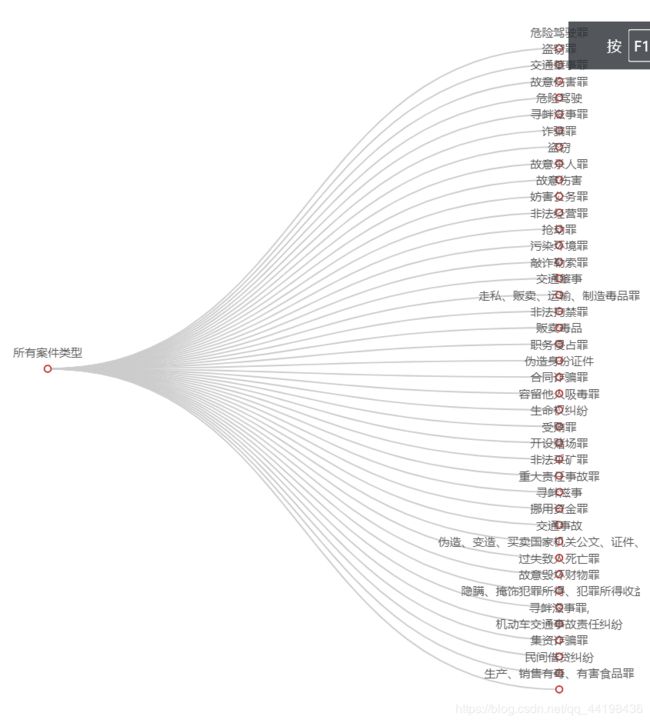
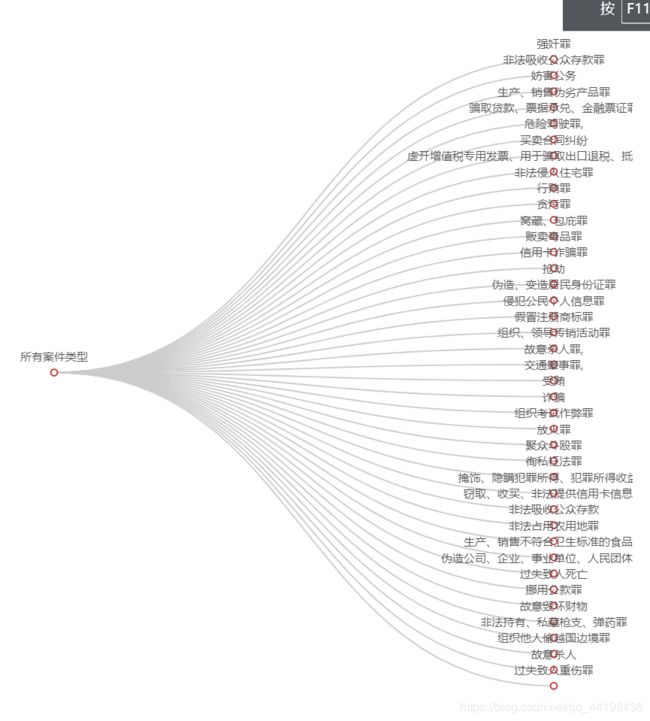
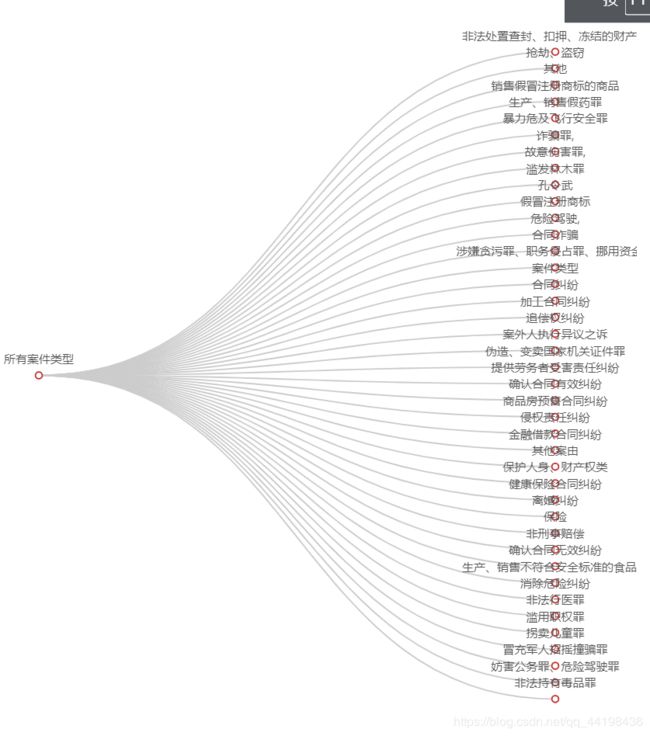
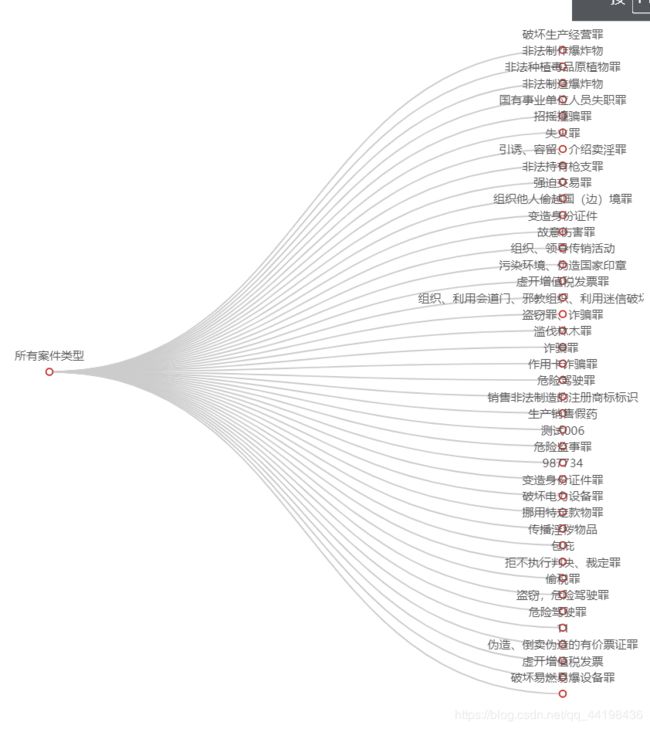
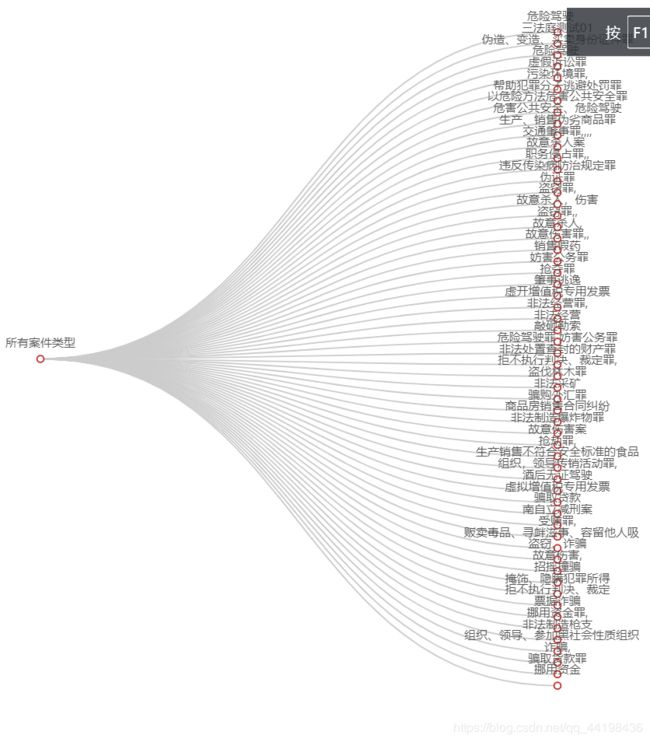
全部案件名称:
代码:
import requests
from lxml import etree
import re,time
import pandas as pd
import csv
import numpy as np

url='http://tszb.sdcourt.gov.cn:81/findHomePageContents.action'
header={'user-agent': 'Mozilla/5.0 (Windows NT 10.0; Win64; x64) AppleWebKit/537.36 (KHTML, like Gecko) Chrome/79.0.3945.88 Safari/537.36'}
url_list=[]#所有网页

#获取当前页面的所有网页
#通过分析,下一页不是通过URL的变化,而是携带data访问数据,所以为访问第二页数据我们,我们要携带data
def down_url():
    try:
        for n in range(1,100):
            data={'start': '{}'.format(n),
            'limit': '16',
            'contentsearch.tcase.casetype': '1',
            'contentsearch.tcase.casetype': '1',
            'contentsearch.ttrial.begindatetime': '',
            'contentsearch.ttrial.enddatetime': '',
            'contentsearch.ttrial.clerk': '',
            'contentsearch.tcase.party': '',
            'contentsearch.tcase.casecode': ''}
            res=requests.post(url,headers=header,data=data).text
            href=re.findall(',res)
            for i in range(len(href)):
                new_url='http://tszb.sdcourt.gov.cn:81/'+href[i].replace('"','')
                data =[[new_url]]
                with open('F:/Code/python/folder/url.csv', 'a',newline='') as f:
                        w = csv.writer(f)
                        w.writerows(data)
                        #time.sleep(0.7)
            print('成功获取第{}的页面所有网址'.format(n))
        print('全部完成-------------------')
    except:
        print('{}下载失败'.format(n))

#获取-时间,类型,地点
def get_text():
    for i in range(len(url_list)):
        res=requests.get(url_list[i],headers=header).text
        place=re.findall('法院:,res)[0]
        time=re.findall('开庭时间:,res)[0]
        thing_type=re.findall('											title="(.*?)">',res)[0]
        data=[[place,time,thing_type]]
        print('{}{}{}'.format(place,time,thing_type))
        with open('F:/Code/python/folder/thing.csv', 'a',newline='') as f:
            w = csv.writer(f)
            w.writerows(data)
        #time.sleep(0.7)

#处理网址,将网址添加到列表中
def check():
    url_csv=pd.read_csv('F:/Code/python/url.csv',usecols=[0],header=None)
    url_csv=np.array(url_csv)
    for i in range(1,3168,2):
        url_list.append(url_csv[i][0])
不知道为何xpath无法匹配到正确信息,而是一个[],只好改换正则匹配。
step2:
'''获取数据'''
import pandas as pd
import numpy as np
#地点
data_place=pd.read_csv('thing.csv',usecols=[0],header=None,encoding='GBK')
#时间
data_time=pd.read_csv('thing.csv',usecols=[1],header=None,encoding='GBK')
#类型
data_type=pd.read_csv('thing.csv',usecols=[2],header=None,encoding='GBK')
'''统计次数函数'''
import collections
def statistics(arg):
    dic = collections.Counter(arg)
    return dic
#将pandas获取的数据转换为列表
a=np.array(data_place).reshape(-1,)
b=np.array(data_time).reshape(-1,)
c=np.array(data_type).reshape(-1,)
#将时间和地点进行清洗
list_time=[]
list_place=[]
for i in b:
    list_time.append(i[:10])#时间
for n in a:
    list_place.append(n[:2])#地点
'''统计案件类型'''
case_type=statistics(c)
case_place=statistics(list_place)
case_time=statistics(list_time)
#元组转换
all_time = case_time.most_common(len(case_time))
all_type = case_type.most_common(len(case_type))
all_place = case_place.most_common(len(case_place))
'''取前50个'''
top_50 = case_type.most_common(50)
top50_case_name=[]
top50_case_num=[]
for i in top_50:
    top50_case_name.append(i[0])
    top50_case_num.append(i[1])
#地点
list_place_name=[]
list_place_num=[]
for i in all_place:
    if i[0]=='开庭':
        continue
    else:
        list_place_name.append(i[0])
        list_place_num.append(i[1])
from pyecharts.faker import Faker
from pyecharts import options as opts
from pyecharts.charts import Bar
from pyecharts.commons.utils import JsCode
from pyecharts.charts import Lin
from pyecharts.charts import Bar
from pyecharts import options as opts
from pyecharts.charts import Pie,Grid
from pyecharts import options as opts
from pyecharts.charts import Page, WordCloud
from pyecharts.globals import SymbolType

#柱状图
bar = (
    Bar(init_opts=opts.InitOpts(width='900px',height='500px'))
    .add_xaxis(top50_case_name[:10])
    .add_yaxis("案件类型",top50_case_num[:10])
    .set_global_opts(
            xaxis_opts=opts.AxisOpts(axislabel_opts=opts.LabelOpts(rotate=-45)),
    title_opts=opts.TitleOpts(title="山东省", subtitle="2018.6.22-2020.1.17"))
)
bar.render('1.html')

#饼状图
def pie_base():
    c = (
        Pie(init_opts=opts.InitOpts(width='1000px',height='900px'))
        .add("",[list(z) for z in zip(top50_case_name[:40],top50_case_num[:40])],center=["60%", "50%"])
        .set_global_opts(title_opts=opts.TitleOpts(title="山东省详情"))
        .set_series_opts(label_opts=opts.LabelOpts(formatter="{b}: {c}"))
        .set_global_opts(
            legend_opts=opts.LegendOpts(is_show=False),
        )
    )
    return c
pie_base().render('3.html')

#词云
words = case_type.most_common(len(case_type))
def wordcloud_base() -> WordCloud:
    c = (
        WordCloud()
        .add("", words)
        .set_global_opts(title_opts=opts.TitleOpts(title="类型词云"))
    )
    return c
wordcloud_base().render('4.html')

#地图
def map_guangdong() -> Map:
    c = (
        Map()
        #这里不在统计各市具体数据而是简单排序粗略比较
        .add("2018-2020", [['临沂市',100],['聊城市',80],['莱芜市',70],['淄博市',65],['东营市',75],['济南市',2],['青岛市',50],['滨州市',20],['枣庄市',9],['潍坊市',1]], "山东")
        .set_global_opts(
            title_opts=opts.TitleOpts(title="案件分布图"),
            visualmap_opts=opts.VisualMapOpts(),
        )
    )
    return c
map_guangdong().render('6.html')

#树图
from pyecharts.charts import Page, Tree
def tree_base() -> Tree:
    data = [
        {
            "children": list_all_type[160:218],
            "name": "所有类型"
        }

    ]
    c = (
        Tree(init_opts=opts.InitOpts(width='700px',height='900px'))
        .add("", data)
        .set_global_opts(title_opts=opts.TitleOpts(title="Tree"))
    )
    return c
tree_base().render('7.html')

from pyecharts.charts import Graph, Page

#关系图
def graph_base() -> Graph:
    nodes = [
        {"name": top50_case_name[0], "symbolSize": 5},
        {"name": top50_case_name[1], "symbolSize": 4},
        {"name": top50_case_name[2], "symbolSize": 3},
        {"name": top50_case_name[3], "symbolSize": 2},
        {"name": top50_case_name[4], "symbolSize": 1},
    ]
    links = []
    for i in nodes:
        for j in nodes:
            links.append({"source": i.get("name"), "target": j.get("name")})
    c = (
        Graph()
        .add("", nodes, links, repulsion=8000)
        .set_global_opts(title_opts=opts.TitleOpts(title="top5"))
    )
    return c
graph_base().render('10.html')

#漏斗图
from pyecharts.charts import Funnel, Page
def funnel_base() -> Funnel:
    c = (
        Funnel(init_opts=opts.InitOpts(width='1000px',height='900px'))
        .add("商品", [list(z) for z in zip(list_place_name, list_place_num)])
    )
    return c
funnel_base().render('12.html')
