import pyecharts
from pyecharts.charts import Radar
from pyecharts import options as opts
import requests
from bs4 import BeautifulSoup
import pandas as pd
import matplotlib.pyplot as plt
import seaborn as sns
import matplotlib
import numpy as np
plt.rcParams['font.sans-serif'] = ['SimHei']
plt.rcParams['axes.unicode_minus'] = False
class item:
def __init__(self):
self.date = list()
self.max_temp = list()
self.min_temp = list()
self.weather = list()
self.wind_direction = list()
Data_Box = item()
def get_url(city='beijing'):
'''
city为城市拼写的字符串,year为年份+月份
'''
for time in range(201801, 201813):
url = "http://lishi.tianqi.com/{}/{}.html".format(city, time)
yield url
def get_datas():
urls = get_url()
cookie = {
"cityPy": "UM_distinctid=171f2280ef23fb-02a4939f3c1bd4-335e4e71-144000-171f2280ef3dab; Hm_lvt_ab6a683aa97a52202eab5b3a9042a8d2=1588905651; CNZZDATA1275796416=871124600-1588903268-%7C1588990372; Hm_lpvt_ab6a683aa97a52202eab5b3a9042a8d2=1588994046"}
header = {
"User-Agent": "Mozilla/5.0 (Windows NT 10.0; WOW64) AppleWebKit/537.36 (KHTML, like Gecko) Chrome/70.0.3538.25 Safari/537.36 Core/1.70.3756.400 QQBrowser/10.5.4039.400"}
for url in urls:
html = requests.get(url=url, headers=header, cookies=cookie)
soup = BeautifulSoup(html.text, 'html.parser')
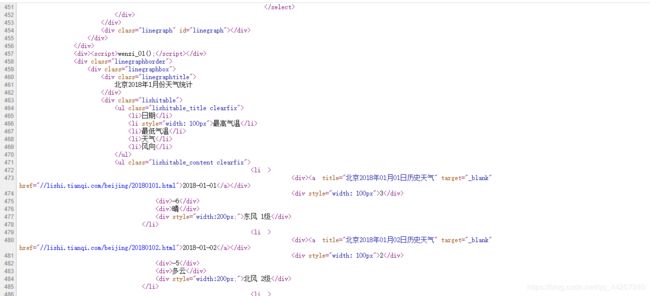
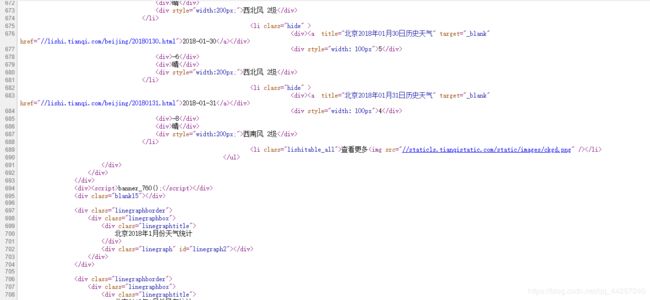
ul = soup.find_all("ul", class_='lishitable_content clearfix')[0]
lis = ul.find_all("li")[:-1]
for li in lis:
div = li.find_all("div")
Data_Box.date.append(div[0].text)
Data_Box.max_temp.append(div[1].text)
Data_Box.min_temp.append(div[2].text)
Data_Box.weather.append(div[3].text)
Data_Box.wind_direction.append(div[4].text.split(" ")[0])
return "数据获取完毕"
def get_result():
get_datas()
result = pd.DataFrame(
{"日期": Data_Box.date, "最高温度": Data_Box.max_temp, "最低温度": Data_Box.min_temp, "天气状况": Data_Box.weather,
"风向": Data_Box.wind_direction})
return result
result = get_result()
print('空数据有', result.isnull().any().sum())
print(result.head(20))
result['日期'] = pd.to_datetime(result['日期'])
result["最高温度"] = pd.to_numeric(result['最高温度'])
result["最低温度"] = pd.to_numeric(result['最低温度'])
result["平均温度"] = (result['最高温度'] + result['最低温度']) / 2
print(result.dtypes)
sns.distplot(result['平均温度'])
df = result.groupby(['天气状况'])['日期'].count()
df_bar = pd.DataFrame(df)
df_bar.plot.bar()
result['是否降水'] = result['天气状况'].apply(lambda x: '未降水' if x in ['晴', '多云', '阴', '雾', '浮尘', '霾', '扬沙'] else '降水')
rain = result.groupby([result['日期'].apply(lambda x: x.month), '是否降水'])['是否降水'].count()
month = [str(i) + "月份" for i in range(1, 13)]
is_rain = [rain[i]['降水'] if '降水' in rain[i].index else 0 for i in range(1, 13)]
no_rain = [rain[i]['未降水'] if '未降水' in rain[i].index else 0 for i in range(1, 13)]
line = pd.DataFrame({'降水天数': is_rain, '未降水天数': no_rain}, index=[x for x in range(1, 13)])
line.plot()
result.groupby(result['日期'].apply(lambda x: x.month)).mean().plot(kind='line')
directions = ['北风', '西北风', '西风', '西南风', '南风', '东南风', '东风', '东北风']
labels = np.array(directions)
dataLenth = 8
v = []
days = result['风向'].value_counts()
for d in directions:
v.append(days[d])
data_radar = np.array(v)
angles = np.linspace(0, 2 * np.pi, dataLenth, endpoint=False)
data_radar = np.concatenate((data_radar, [data_radar[0]]))
angles = np.concatenate((angles, [angles[0]]))
plt.polar(angles, data_radar, 'bo-', linewidth=1)
plt.thetagrids(angles * 180 / np.pi, labels)
plt.fill(angles, data_radar, facecolor='r', alpha=0.25)
plt.ylim(0, 100)
plt.title('wind')
plt.savefig("wind.png")
plt.show()

这两张图片是当时的天气网源代码截图,因为网站的代码时常会变动,变了得话,爬虫的soup部分就要重写。


