python数据分析2——matplotlib应用和应力波的绘制
matplotlib是一个绘制二维图形的、优秀的python第三方库,里面包含很多中二维图形的绘制方法,下面来学习一下:
1、饼图
使用plt中的pie函数可以直接绘制饼图,其中的参数包含,绘制的数据、选择突出的部分、百分数显示格式、开始的角度等。
代码如下:
import matplotlib.pyplot as plt
labels = 'Frog', 'Hogs', 'Dogs', 'Logs'
sizes = [15, 30, 45, 10]
explode = [0, 0.1, 0, 0]
plt.pie(sizes, explode = explode, labels = labels, autopct = '%1.1f%%', shadow = False, startangle = 90)
plt.axis('equal')
plt.show()
效果如下:

2、直方图
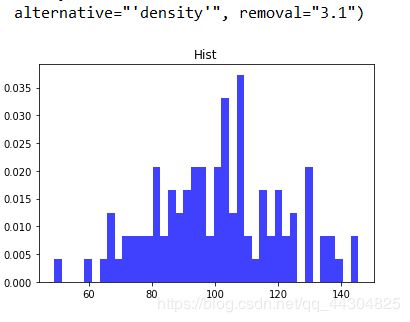
直接用plt和hist方法可以直接绘制直方图,里面需要重点注意的是第二个参数,表示的是生成柱的数量。
代码如下:
import numpy as np
import matplotlib.pyplot as plt
np.random.seed(0)
mu, signa = 100, 20
a = np.random.normal(mu, signa, size = 100)
plt.hist(a, 40, normed = 1, histtype = 'stepfilled', facecolor = 'b', alpha = 0.75)
plt.title('Hist')
plt.show()
效果如下:

3、极坐标图
这里用面向对象的方式来制作极坐标图:
import numpy as np
import matplotlib.pyplot as plt
n = 10
thate = np.linspace(0.0, 2*np.pi, n, endpoint = False)
radii = 10 * np.random.rand(n)
width = np.pi / 2 * np.random.rand(n)
ax = plt.subplot(111, projection = 'polar')
bars = ax.bar(thate, radii, width = width, bottom = 0.0)
for r, bar in zip(radii, bars):
    bar.set_facecolor(plt.cm.viridis(r / 10.))
    bar.set_alpha(0.5)
plt.show()
效果如下:

4、引力波的绘制
获取引力波的相关数据:
https://python123.io/dv/grawave.html
(其实这个除了绘图部分,我也有些地方没看懂,明天好好研究一下)
代码:
import numpy as np
import matplotlib.pyplot as plt
from scipy.io import wavfile
rate_h, hstrain = wavfile.read('H1_Strain.wav', 'rb')
rate_l, lstrain = wavfile.read('L1_Strain.wav', 'rb')
reftime, ref_H1 = np.genfromtxt('grawave.txt').transpose()
htime_interval = 1 / rate_h
ltime_interval = 1 / rate_l
fig = plt.figure(figsize = (12, 6))
#H
htime_len = hstrain.shape[0] / rate_h
htime = np.arange(-htime_len / 2, htime_len / 2, htime_interval)
plth = fig.add_subplot(221)
plth.plot(htime, hstrain, 'y')
plth.set_xlabel('Time (seconds)')
plth.set_ylabel('H1 Strain')
plth.set_title('H1 Strain')
#L
ltime_len = lstrain.shape[0] / rate_l
ltime = np.arange(-ltime_len / 2, ltime_len / 2, ltime_interval)
plth = fig.add_subplot(222)
plth.plot(ltime, lstrain, 'g')
plth.set_xlabel('Time (seconds)')
plth.set_ylabel('L1 Strain')
plth.set_title('L1 Strain')
#idea
pltref = fig.add_subplot(212)
pltref.plot(reftime, ref_H1)
pltref.set_xlabel("Time (seconds)")
pltref.set_ylabel("Template Strain")
pltref.set_title('Tempate')
fig.tight_layout()
#show
plt.savefig('Gravitational_Wave_Original.png')
plt.show()
plt.close(fig)
