QCustomPlot的基本使用
QCustomPlot是QT下一个方便易用的绘图工具,只有两个文件qcustomplot.h和qcustomplot.cpp组成。源文件和使用文档可从官方网站下载。
官方网站:http://www.qcustomplot.com/
下面介绍下基本使用:
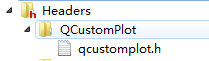
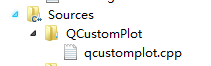
1、将qcustomplot.cpp和qcustomplot.h拷贝到工程目录下,并在工程中添加文件。
并在工程的pro文件添加printsupport
greaterThan(QT_MAJOR_VERSION, 4): QT += widgets printsupport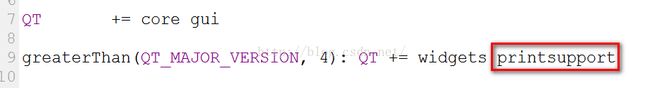
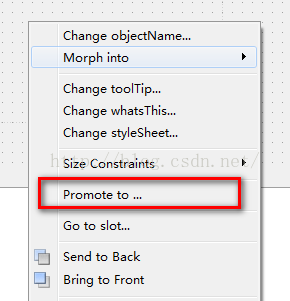
2、在QT里面添加一个Widget命名为qcustomplotWidget,对这个Widget右击,点击Promote to...
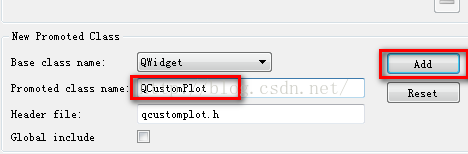
提升类名为QCustomPlot,并点击Add:
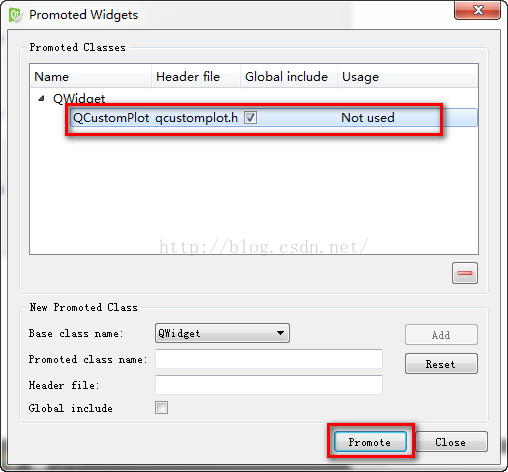
最后选中点击Promote:
然后就可以在工程中通过ui->qcustomplotWidget直接使用了。
3、通过本人项目来展示相关代码,实际参考了官网上下载的文档和例程:
设置x,y轴:
   ui->qcustomplot->setInteractions(QCP::iRangeDrag | QCP::iRangeZoom | QCP::iSelectAxes |	//设置交互方式
                                      QCP::iSelectLegend | QCP::iSelectPlottables);
//    ui->qcustomplot->axisRect()->setupFullAxesBox();
    QBrush qBrush(QColor(255,255,255));//设置背景色
    ui->qcustomplot->setBackground(qBrush);

    ui->qcustomplot->legend->setVisible(true);
    ui->qcustomplot->xAxis->setLabel("Time Axis (t/s)");//设置x轴
    ui->qcustomplot->xAxis->setTicks(false);

    ui->qcustomplot->yAxis->setLabel("EEG Channel");//设置y轴
    ui->qcustomplot->yAxis->setAutoTicks(true);
    ui->qcustomplot->yAxis->setAutoTickStep(true);
    ui->qcustomplot->yAxis->setAutoSubTicks(true);
ui->qcustomplot->yAxis->setRange(8000.0,10000.0);添加图层:
    graph1 = ui->qcustomplot->addGraph();//增加一条曲线图层
    graph2 = ui->qcustomplot->addGraph();//增加一条曲线图层


//QCPScatterStyle QCPcs1(QCPScatterStyle::ssSquare, QColor(255,0,0),QColor(255,0,0),3);//设置折线图的点的形状及颜色
    QPen qPen1(QColor(255,0,0));
//   graph_1->setScatterStyle(QCPcs1);
    graph1->setPen(qPen1);//设置画笔颜色
    graph1->setData(x,y);
    graph1->setName(QString("F3"));


//QCPScatterStyle QCPcs2(QCPScatterStyle::ssCircle, QColor(0,255,0),QColor(0,255,0),3);//设置折线图的点的形状及颜色
    QPen qPen2(QColor(0,255,0));
//   graph2->setScatterStyle(QCPcs2);
    graph2->setPen(qPen2);//设置画笔颜色
    graph2->setData(x,y);
    graph2->setName(QString("F4"));
添加数据:
可用graph1->addData()函数,具体函数参数为
void  addData (const QCPDataMap &dataMap)
void  addData (const QCPData &data)
void  addData (double key, double value)
void  addData (const QVector< double > &keys, const QVector< double > &values)
4、如果要实现对图的缩放移动,可以添加一下槽函数:
/**
 * @brief MainWindow::mousePress
 * 鼠标点击
 */
void MainWindow::mousePress()
{
  // if an axis is selected, only allow the direction of that axis to be dragged
  // if no axis is selected, both directions may be dragged
  if (ui->qcustomplotWidget->xAxis->selectedParts().testFlag(QCPAxis::spAxis))
  {
    ui->qcustomplotWidget->axisRect()->setRangeDrag(ui->qcustomplotWidget->xAxis->orientation());
  }
  else if (ui->qcustomplotWidget->yAxis->selectedParts().testFlag(QCPAxis::spAxis))
  {
    ui->qcustomplotWidget->axisRect()->setRangeDrag(ui->qcustomplotWidget->yAxis->orientation());
  }
  else
  {
    ui->qcustomplotWidget->axisRect()->setRangeDrag(Qt::Horizontal|Qt::Vertical);
  }
}

/**
 * @brief MainWindow::mouseWheel
 * 鼠标滚轮
 */
void MainWindow::mouseWheel()
{
  // if an axis is selected, only allow the direction of that axis to be zoomed
  // if no axis is selected, both directions may be zoomed
  if (ui->qcustomplotWidget->xAxis->selectedParts().testFlag(QCPAxis::spAxis))
  {
    ui->qcustomplotWidget->axisRect()->setRangeZoom(ui->qcustomplotWidget->xAxis->orientation());
  }
  else if (ui->qcustomplotWidget->yAxis->selectedParts().testFlag(QCPAxis::spAxis))
  {
    ui->qcustomplotWidget->axisRect()->setRangeZoom(ui->qcustomplotWidget->yAxis->orientation());
  }
  else
  {
    ui->qcustomplotWidget->axisRect()->setRangeZoom(Qt::Horizontal|Qt::Vertical);
  }
}

/**
 * @brief MainWindow::selectionChanged
 * 曲线选择
 */
void MainWindow::selectionChanged()
{
  /*
   normally, axis base line, axis tick labels and axis labels are selectable separately, but we want
   the user only to be able to select the axis as a whole, so we tie the selected states of the tick labels
   and the axis base line together. However, the axis label shall be selectable individually.

   The selection state of the left and right axes shall be synchronized as well as the state of the
   bottom and top axes.

   Further, we want to synchronize the selection of the graphs with the selection state of the respective
   legend item belonging to that graph. So the user can select a graph by either clicking on the graph itself
   or on its legend item.
  */

  // make top and bottom axes be selected synchronously, and handle axis and tick labels as one selectable object:
  if (ui->qcustomplotWidget->xAxis->selectedParts().testFlag(QCPAxis::spAxis) || ui->qcustomplotWidget->xAxis->selectedParts().testFlag(QCPAxis::spTickLabels) ||
      ui->qcustomplotWidget->xAxis2->selectedParts().testFlag(QCPAxis::spAxis) || ui->qcustomplotWidget->xAxis2->selectedParts().testFlag(QCPAxis::spTickLabels))
  {
    ui->qcustomplotWidget->xAxis2->setSelectedParts(QCPAxis::spAxis|QCPAxis::spTickLabels);
    ui->qcustomplotWidget->xAxis->setSelectedParts(QCPAxis::spAxis|QCPAxis::spTickLabels);
  }
  // make left and right axes be selected synchronously, and handle axis and tick labels as one selectable object:
  if (ui->qcustomplotWidget->yAxis->selectedParts().testFlag(QCPAxis::spAxis) || ui->qcustomplotWidget->yAxis->selectedParts().testFlag(QCPAxis::spTickLabels) ||
      ui->qcustomplotWidget->yAxis2->selectedParts().testFlag(QCPAxis::spAxis) || ui->qcustomplotWidget->yAxis2->selectedParts().testFlag(QCPAxis::spTickLabels))
  {
    ui->qcustomplotWidget->yAxis2->setSelectedParts(QCPAxis::spAxis|QCPAxis::spTickLabels);
    ui->qcustomplotWidget->yAxis->setSelectedParts(QCPAxis::spAxis|QCPAxis::spTickLabels);
  }

  // synchronize selection of graphs with selection of corresponding legend items:
  for (int i=0; iqcustomplotWidget->graphCount(); ++i)
  {
    QCPGraph *graph = ui->qcustomplotWidget->graph(i);
    QCPPlottableLegendItem *item = ui->qcustomplotWidget->legend->itemWithPlottable(graph);
    if (item->selected() || graph->selected())
    {
      item->setSelected(true);
      graph->setSelected(true);
    }
  }
}
并连接信号:
    connect(ui->qcustomplotWidget, SIGNAL(mousePress(QMouseEvent*)), this, SLOT(mousePress()));//连接鼠标点击信号和槽
    connect(ui->qcustomplotWidget, SIGNAL(mouseWheel(QWheelEvent*)), this, SLOT(mouseWheel()));//连接鼠标滚轮信号和槽
    connect(ui->qcustomplotWidget, SIGNAL(selectionChangedByUser()), this, SLOT(selectionChanged()));//连接曲线选择信号和槽
最后效果图: