Android 图表开发开源库MPAndroidChart
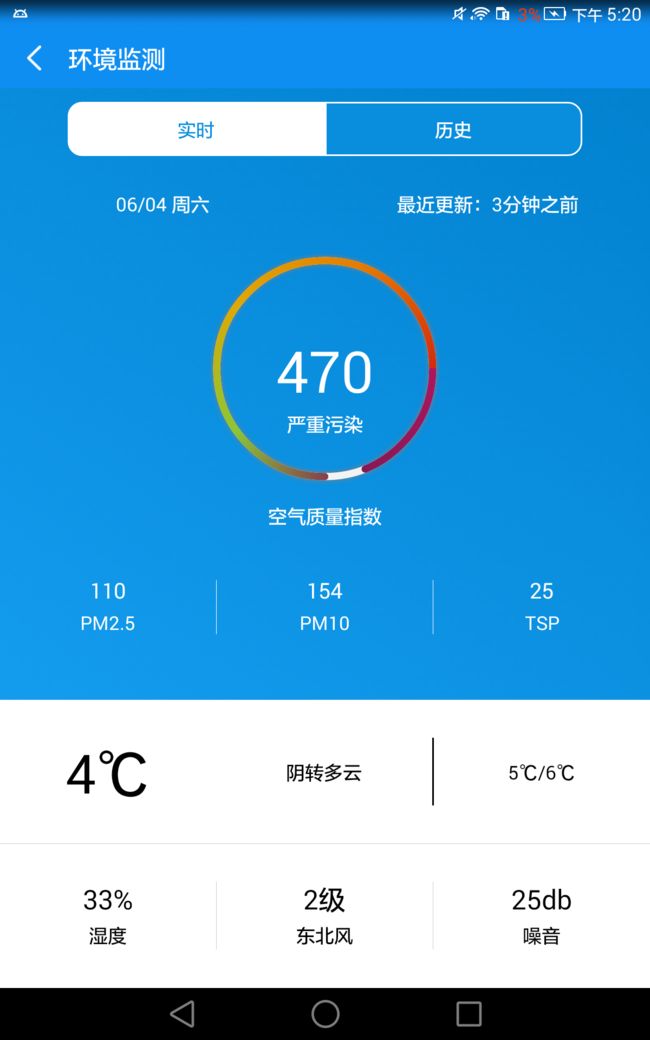
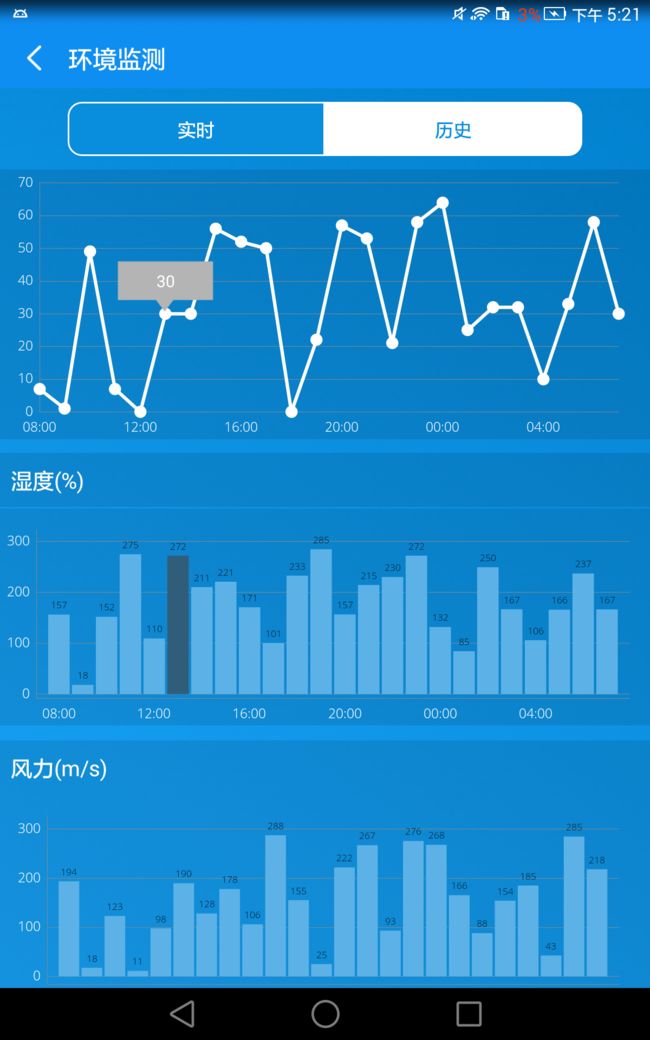
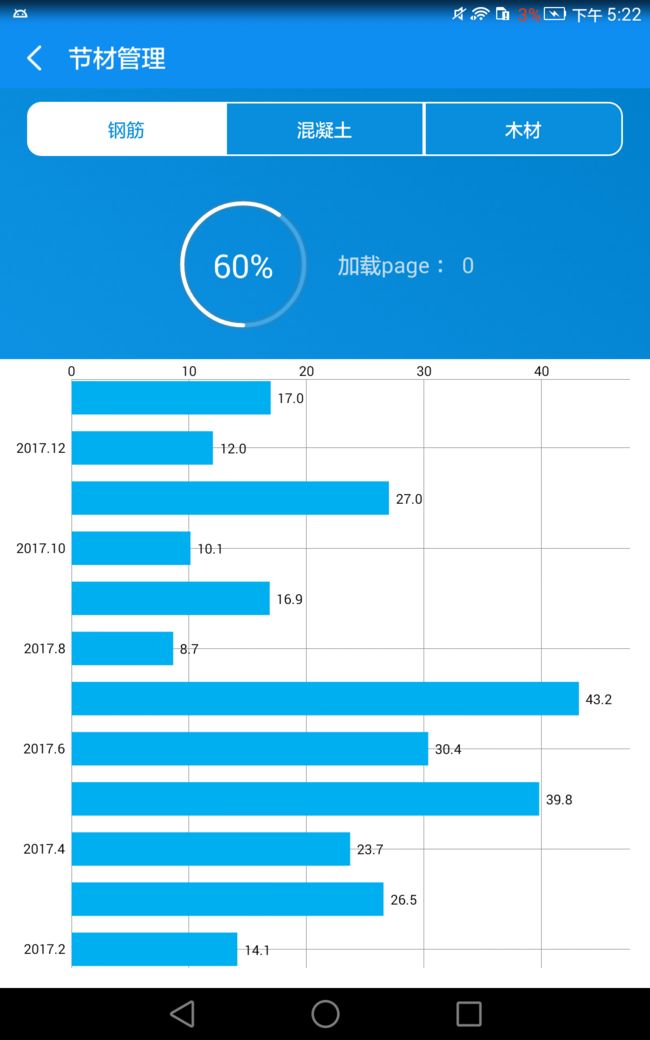
上面是APP中实现的效果图(点击可以放大查看)
MpAndroidChart 的下载地址
图1的效果不是用这个实现的,如果感兴趣可以参考我这篇文章 Android渐变圆环
总体来说,MPAndroidChart可能是目前Android 开发最好用的一个三方库了,功能非常强大,集成简单。
直接导入作为依赖就可以。
常用的效果(柱状图(横向,竖向),线状图(多种效果),饼状图,点状图都包括),属性也很简单,我们使用的时候只需要熟悉控件的各种属性即可。
开源库的核心功能:
- 支持x,y轴缩放
- 支持拖拽
- 支持手指滑动
- 支持高亮显示
- 支持保存图表到文件中
- 支持从文件(txt)中读取数据
- 预先定义颜色模板
- 自动生成标注
- 支持自定义x,y轴的显示标签
- 支持x,y轴动画
- 支持x,y轴设置最大值和附加信息
- 支持自定义字体,颜色,背景,手势,虚线等
以 柱状图举列使用:
xml中直接定义
    android:id="@+id/chart_pm_one"
    android:layout_width="match_parent"
    android:layout_height="155dp" />
Activity中 初始化
protected Typeface mTfLight;
mTfLight = Typeface.createFromAsset(getActivity().getAssets(), "OpenSans-Light.ttf");//字体
mChartPmOne = (BarChart) view.findViewById(R.id.chart_pm_one);
BarData data = generateData(3);//生成数据
//设置字体及颜色
data.setValueTypeface(mTfLight);
data.setValueTextColor(Color.BLACK);
//设置
mChartPmOne.getDescription().setEnabled(false);
mChartPmOne.setDrawGridBackground(false);
mChartPmOne.setGridBackgroundColor(Color.WHITE);
XAxis xAxis = mChartPmOne.getXAxis();
xAxis.setPosition(XAxis.XAxisPosition.BOTTOM);
xAxis.setTypeface(mTfLight);
xAxis.setDrawGridLines(false);
xAxis.setTextColor(Color.WHITE);

xAxis.setValueFormatter(new IAxisValueFormatter() {
    private SimpleDateFormat mFormat = new SimpleDateFormat("HH:mm");

    @Override
    public String getFormattedValue(float value, AxisBase axis) {

        long millis = TimeUnit.HOURS.toMillis((long) value);
        return mFormat.format(new Date(millis));
    }
});
YAxis leftAxis = mChartPmOne.getAxisLeft();
leftAxis.setTypeface(mTfLight);
leftAxis.setTextColor(Color.WHITE);
leftAxis.setLabelCount(5, false);
leftAxis.setSpaceTop(15f);
YAxis rightAxis = mChartPmOne.getAxisRight();
rightAxis.setEnabled(false);
mChartPmOne.setData(data);
Legend l = mChartPmOne.getLegend();
mChartPmOne.getLegend().setEnabled(false);
mChartPmOne.setFitBars(true);
mChartPmOne.animateY(700);
private BarData generateData(int cnt) { int state=0; ArrayListentries = new ArrayList (); for (int i = 0; i < 24; i++) { state = i; BarEntry barEntry = new BarEntry(i, (float) (Math.random() * 300) + 0,state); entries.add(barEntry); } BarDataSet d = new BarDataSet(entries, "New DataSet " + cnt); // d.setColor(getResources().getColor(R.color.color_environment_excellent)); int[] VORDIPLOM_COLORS = {getResources().getColor(R.color.color_environment_severe),getResources().getColor(R.color.color_environment_serious), getResources().getColor(R.color.color_environment_excellent), getResources().getColor(R.color.color_environment_good), getResources().getColor(R.color.color_environment_mild),getResources().getColor(R.color.color_environment_moderate)}; d.setColors(VORDIPLOM_COLORS); d.setBarShadowColor(Color.rgb(203, 203, 203)); ArrayList sets = new ArrayList (); sets.add(d); BarData cd = new BarData(sets); cd.setBarWidth(0.9f); return cd; }

图表包含 X轴(横轴)getAxis , Y轴(左轴,竖轴)getAsixLeft, 右轴getAxisRight
插入一点:Y轴的最大值,最小值范围是可以手动设定的,如果没有手动设定Y轴会自动取传进数据的 最大值作为最大值,最小值作为最小值。
leftAxis.setAxisMaximum(200);
leftAxis.setAxisMinimum(0);
通过获取相应的轴对象 设置 这几个轴对应相应的属性(字体,颜色,标签,线宽,网格线等等)
整理了一下 图表中常用的一些方法
动画:
所有的图表类型都支持下面三种动画,分别是x方向,y方向,xy方向。
•animateX(int durationMillis): x轴方向
•animateY(int durationMillis): y轴方向
•animateXY(int xDuration, int yDuration): xy轴方向
XY轴的绘制setEnabled(boolean enabled):设置轴是否被绘制。默认绘制,false不会被绘制。
setDrawLabels(boolean enabled):设置为true打开绘制轴的标签。
setDrawAxisLine(boolean enabled): 设置为true,绘制轴线
setDrawGridLines(boolean enabled): 设置为true绘制网格线。
定义轴线样式setTextColor(int color): 设置轴标签文本颜色。
setTextSize(float size):设置轴标签的字体大小。
setTypeface(Typeface tf):设置轴标签的自定义Typeface(Typeface.createFromAsset(getAssets(), "字体文件名");)
setGridColor(int color): 设置网格线颜色。
setGridLineWidth(float width):设置网格线宽度。
setAxisLineColor(int color):设置此轴的坐标轴的颜色。
setAxisLineWidth(float width): 设置此轴的坐标轴的宽度。
setVisibleXRangeMaximum(float maxXRange):设置x轴最多显示数据条数,(要在设置数据源后调用,否则是无效的)
enableGridDashedLine(float lineLength, float spaceLength, float phase): 显示网格线虚线模式,"lineLength"控制短线条的长度,"spaceLength"控制两段线之间的间隔长度,"phase"控制开始的点。
setTouchEnabled(boolean enabled): 允许你打开或者关闭与图表的所有触摸交互的情况。设置是否可以触摸,如为false,则不能拖动,缩放等
setDragEnabled(boolean enabled): 打开或关闭对图表的拖动。
setScaleEnabled(boolean enabled):打开或关闭对图表所有轴的的缩放。
setScaleXEnabled(boolean enabled): 打开或关闭x轴的缩放
setScaleYEnabled(boolean enabled): 打开或关闭y轴的缩放。
setPinchZoom(boolean enabled): 如果设置为true,挤压缩放被打开。如果设置为false,x和y轴可以被单独挤压缩放。
setHighlightEnabled(boolean enabled): 如果设置为true,在图表中选中触屏高亮。
setHighlightPerDragEnabled(boolean enabled): 设置为true时允许高亮显示拖动结束的对象在缩放到最下时。默认:true
setHighlightIndicatorEnabled(boolean enabled): 如果设置为true, 指标线(或杆)将展示被选择的线的绘制的值。
自定义轴线的值
setAdjustXLabels(boolean enabled):如果被设置为true,x轴条目将依赖于它自己在进行缩放的时候。如果设置为false,x轴条目将总是保持相同。
setAvoidFirstLastClipping(boolean enabled):如果设置为true,图表将避免第一个和最后一个标签条目被减掉在图表或屏幕的边缘。
setSpaceBetweenLabels(int characters): 设置x轴标签之间的空间字符数,默认是4个。
setPosition(XAxisPosition pos):设置XAxis应该出现的位置。可以选择TOP,BOTTOM,BOTH_SIDED,TOP_INSIDE或者BOTTOM_INSIDE。
setDescription(String desc): 设置表格的描述
• setDrawYValues(boolean enabled): 设置是否显示y轴的值的数据
•setValuePaintColor(int color):设置表格中y轴的值的颜色,但是必须设置setDrawYValues(true)
• setValueTypeface(Typeface t):设置字体
• setValueFormatter(DecimalFormat format): 设置显示的格式
• setPaint(Paint p, int which): 自定义笔刷
•public ChartData getDataCurrent():返回ChartData对象当前显示的图表。它包含了所有信息的显示值最小和最大值等
setAxisMaxValue(float max):设置一个自定义的最大值为这条轴,如果设置了,这个值将不会依赖于提供的数据自动计算。
resetAxisMaxValue(): 调用这个将撤销以前设置的最大值。这意味着,你将再次允许轴自动计算它的最大值。
setAxisMinValue(float min): 设置一个自定义的最小值。如果设置了,这个值将不会依赖于你提供的数据进行自动计算。
resetAxisMinValue():调用这个方法撤销以前设置的最小值。这意味着,你将再次允许轴自动计算他的最小值。
setInverted(boolean enabled): 如果设置为true,这个轴将被反向,那意味着最高出的将到底部,最低部的到顶端。
setSpaceTop(float percent):设置在图表上最高处的值相比轴上最高值的顶端空间(总轴范围的百分比)
setSpaceBottom(float percent): 设置在图表上最低处的值相比轴上最低处值的底部空间(总轴范围的百分比)
setShowOnlyMinMax(boolean enabled): 如果打开了,这个轴将展示出它的最小值和最大值。这将忽略或者覆盖定义过的label-count。
setPosition(YAxisLabelPosition pos):设置轴标签应该被绘制的位置。INSIDE_CHART或者OUTSIDE_CHART中的一个。 自定义影响轴的数值范围应该在图表被设置数据之前应用。
•public float getYChartMin(): 返回当前最小值
•public float getYChartMax(): 返回当前最大值
•public float getAverage(): 返回所有值的平均值。
•public float getAverage(int type): 返回平均值
•public PointF getCenter(): 返回中间点
•public Paint getPaint(int which): 得到笔刷
•setDragScaleEnabled(boolean enabled): 设置是否可以拖拽,缩放
•setOnChartValueSelectedListener(OnChartValueSelectedListener l): 设置表格上的点,被点击的时候,的回调函数
•public void highlightValues(Highlight[] highs): 设置高亮显示
•saveToGallery(String title): 保存图表到图库中
•saveToPath(String title, String pathOnSD): 保存.
•setScaleMinima(float x, float y): 设置最小的缩放
•centerViewPort(int xIndex, float val): 设置视口
•fitScreen(): 适应屏幕
希望可以帮助到大家,如果大家还有其他问题,可以加入我的qq群讨论交流。
偶然发现一个大神总结的:https://blog.csdn.net/u014136472/article/details/50273309 非常详细
开发一群:454430053开发二群:537532956


