Matlab根据excel数据画图
1. excel里准备好需要绘画的数据
2. matlab加载excel中数据
>> data = xlsread('thBPM-Results.xlsx', 1); % 读入excel数据3. 根据data画图
3.1 直线图
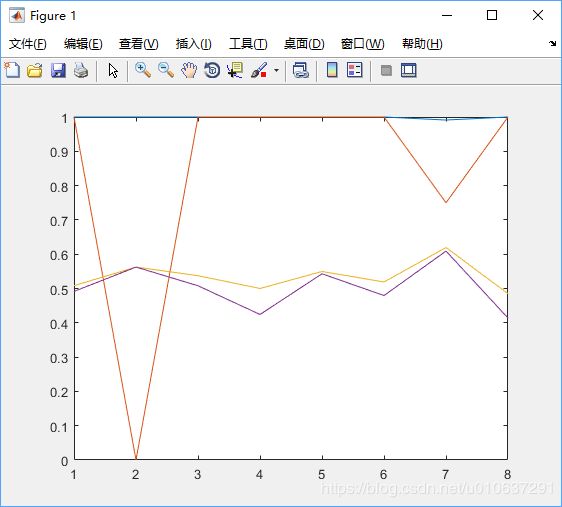
>> data = xlsread('thBPM-Results.xlsx', 1);
>> plot(data(1:end,1:end),'DisplayName','data(1:end,1:end)'); %绘制折线图
3.2 柱形图
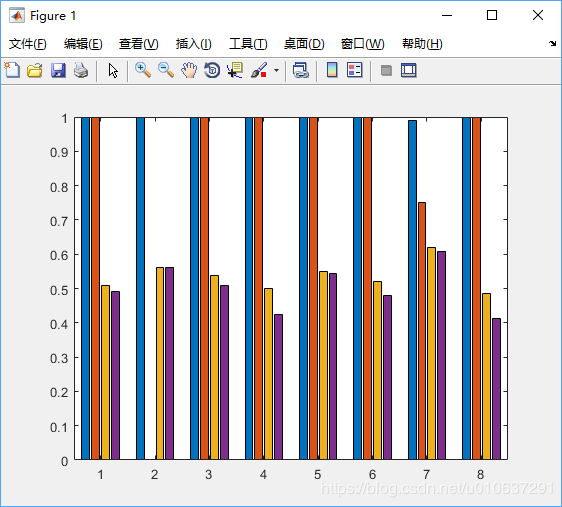
>> data = xlsread('thBPM-Results.xlsx');
>> bar(data(1:end,1:end),'DisplayName','data(1:end,1:end)'); %绘制柱形图
4. 设置绘制图形的X坐标下标
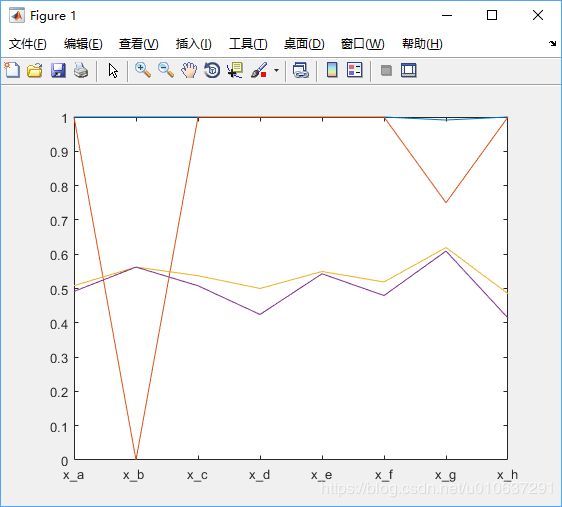
>> data = xlsread('thBPM-Results.xlsx');
>> plot(data(1:end,1:end),'DisplayName','data(1:end,1:end)'); %绘制折线图
>> set(gca,'Xticklabel',{'x\_a','x\_b ','x\_c','x\_d','x\_e','x\_f','x\_g','x\_h'});
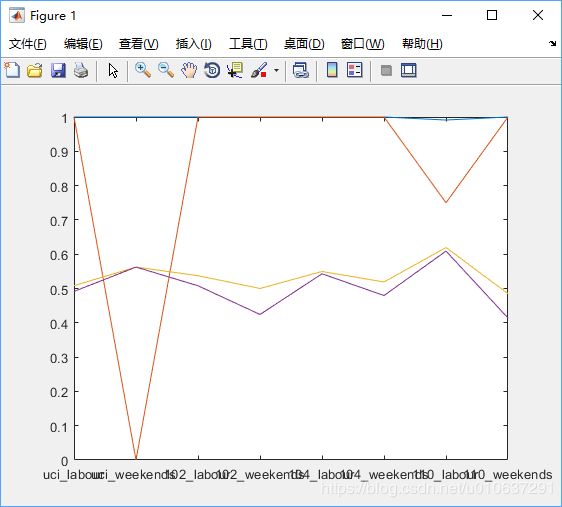
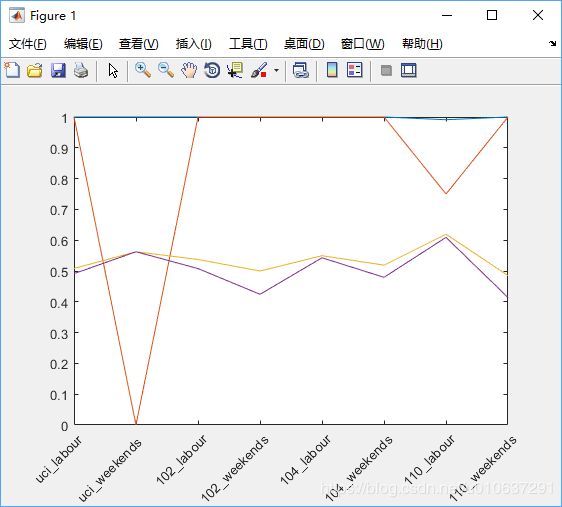
5. 改变下标显示方向:倾斜效果(当x轴下标出现重合之时,如下图)
此时设置方法为:
>> data = xlsread('thBPM-Results.xlsx');
>> plot(data(1:end,1:end),'DisplayName','data(1:end,1:end)'); %绘制折线图
>> set(gca,'Xticklabel',{'uci\_labour','uci\_weekends ','102\_labour','102\_weekends','104\_labour','104\_weekends','110\_labour','110\_weekends'});
>> set(gca,'XTickLabelRotation',45); %设置x坐标下标倾斜45度
显示效果为:
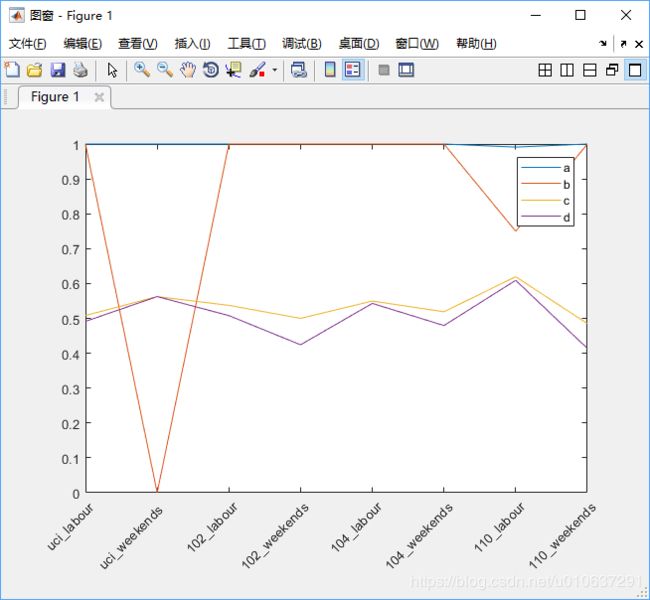
6. 添加图例
>> data = xlsread('thBPM-Results.xlsx');
>> plot(data(1:end,1:end),'DisplayName','data(1:end,1:end)'); %绘制折线图
>> set(gca,'Xticklabel',{'uci\_labour','uci\_weekends ','102\_labour','102\_weekends','104\_labour','104\_weekends','110\_labour','110\_weekends'});
>> set(gca,'XTickLabelRotation',45); %设置x坐标下标倾斜45度
>> legend('a','b','c','d'); %添加图例
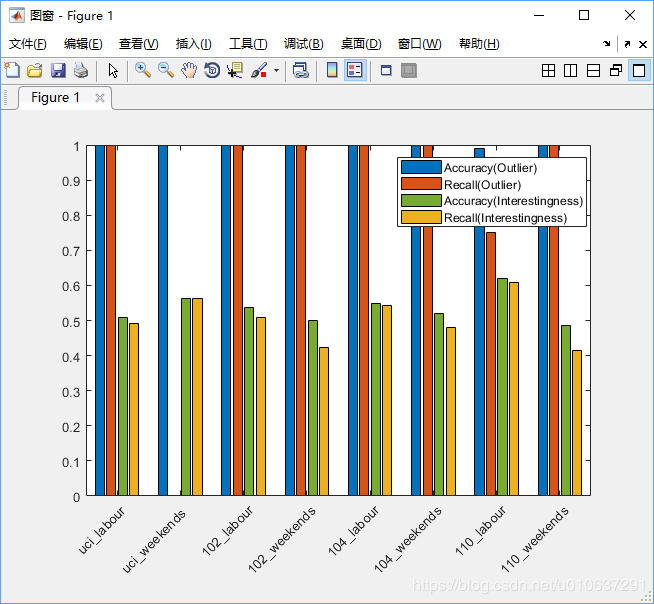
7. 设置柱形图不同柱形的颜色
关于颜色参照:https://www.jianshu.com/p/46af0b95ead7
>> data = xlsread('thBPM-Results.xlsx');
>> bar1 = bar(data(1:end,1:end),'DisplayName','data(1:end,1:end)'); %绘制柱形图
>> set(gca,'Xticklabel',{'uci\_labour','uci\_weekends ','102\_labour','102\_weekends','104\_labour','104\_weekends','110\_labour','110\_weekends'}); %设置横坐标
>> set(gca,'XTickLabelRotation',45); %设置x坐标下标倾斜45度
>> legend('Accuracy(Outlier)','Recall(Outlier)','Accuracy(Interestingness)','Recall(Interestingness)'); %添加图例
>> set(bar1(1),'facecolor',[0 0.447 0.741]) %设置不同圆柱体颜色
>> set(bar1(2),'facecolor',[0.85 0.325 0.098])
>> set(bar1(3),'facecolor',[0.929 0.694 0.125])
>> set(bar1(4),'facecolor',[0.4667 0.6745 0.1882])
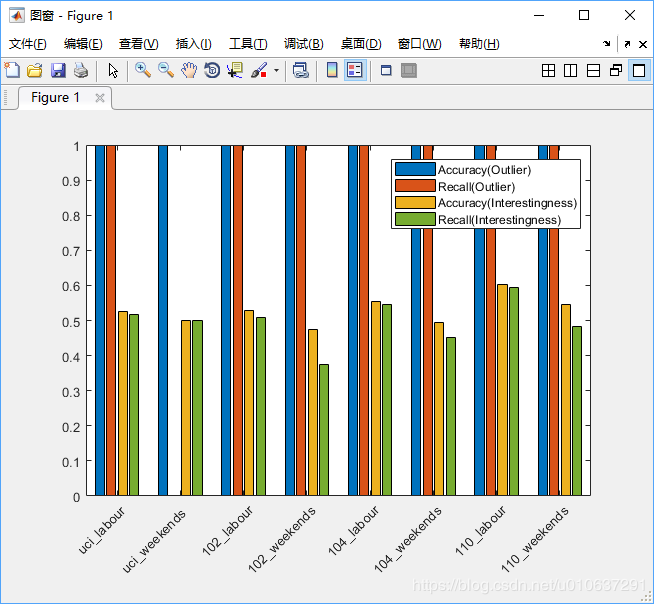
8. 读取excel中不同sheet的数据
>> data = xlsread('thBPM-Results.xlsx', 2); %默认获取第一个sheet
>> bar1 = bar(data(1:end,1:end),'DisplayName','data(1:end,1:end)'); %绘制柱形图
>> set(gca,'Xticklabel',{'uci\_labour','uci\_weekends ','102\_labour','102\_weekends','104\_labour','104\_weekends','110\_labour','110\_weekends'}); %设置横坐标
>> set(gca,'XTickLabelRotation',45); %设置x坐标下标倾斜45度
>> legend('Accuracy(Outlier)','Recall(Outlier)','Accuracy(Interestingness)','Recall(Interestingness)'); %添加图例
>> set(bar1(1),'facecolor',[0 0.447 0.741]) %设置不同圆柱体颜色
>> set(bar1(2),'facecolor',[0.85 0.325 0.098])
>> set(bar1(3),'facecolor',[0.929 0.694 0.125])
>> set(bar1(4),'facecolor',[0.4667 0.6745 0.1882])
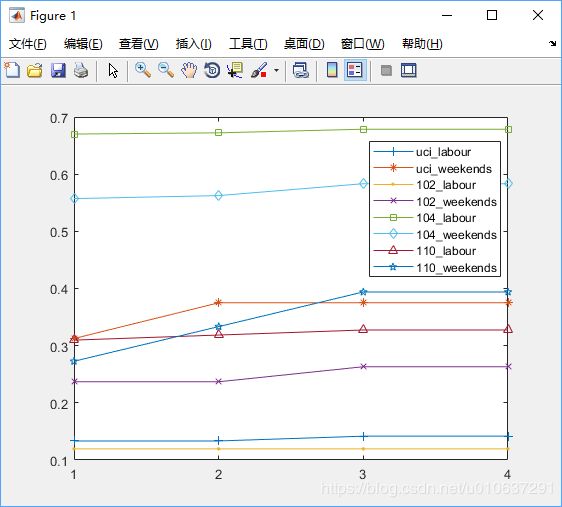
9. 给不同线条添加图标marker,及设置x坐标范围及间隔
>> data = xlsread('thBPM-Results.xlsx', 5); %默认获取第一个sheet
>> plot1 = plot(data(1:end,1:end),'DisplayName','data(1:end,1:end)');
>> set(gca,'XTick',[0:1:4]) %改变x轴坐标间隔显示 这里间隔为1
>> legend('uci\_labour','uci\_weekends ','102\_labour','102\_weekends','104\_labour','104\_weekends','110\_labour','110\_weekends'); %添加图例
>> set(plot1(1),'marker','+') %设置不同线条线型
>> set(plot1(2),'marker','*') %设置不同线条线型
>> set(plot1(3),'marker','.') %设置不同线条线型
>> set(plot1(4),'marker','x') %设置不同线条线型
>> set(plot1(5),'marker','s') %设置不同线条线型
>> set(plot1(6),'marker','d') %设置不同线条线型
>> set(plot1(7),'marker','^') %设置不同线条线型
>> set(plot1(8),'marker','p') %设置不同线条线型
10. 改变x坐标轴从0开始,或改变x坐标轴显示参数:
>> data = xlsread('thBPM-Results.xlsx', 5); %默认获取第一个sheet
>> plot1 = plot(data(1:end,1:end),'DisplayName','data(1:end,1:end)');
>> legend('uci\_labour','uci\_weekends ','102\_labour','102\_weekends','104\_labour','104\_weekends','110\_labour','110\_weekends'); %添加图例
>> set(plot1(1),'marker','+') %设置不同线条线型
>> set(plot1(2),'marker','*') %设置不同线条线型
>> set(plot1(3),'marker','.') %设置不同线条线型
>> set(plot1(4),'marker','x') %设置不同线条线型
>> set(plot1(5),'marker','s') %设置不同线条线型
>> set(plot1(6),'marker','d') %设置不同线条线型
>> set(plot1(7),'marker','^') %设置不同线条线型
>> set(plot1(8),'marker','p') %设置不同线条线型
>> set(gca,'XTick',1:1:4) %改变x轴坐标间隔显示 这里间隔为1
>> set(gca,'Xticklabel',{'0','1','2','3'}); %设置横坐标