视觉无人机高速公路违章检测之——车道线检测
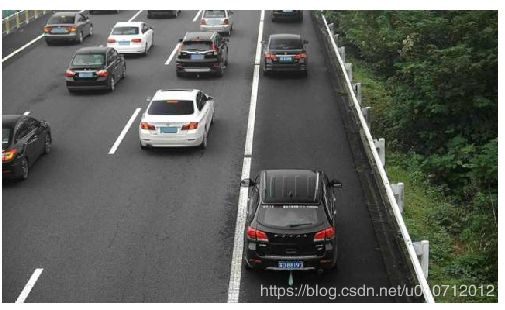
车道线检测在课题当中起着很重要的作用,但是大部分论文都是基于固定摄像头的车道线检测,而本课题是无人机视角,也许会有不一样,但是先拿一张近似的图片去仿真,然后找出问题难点,解决他,再试飞无人机去拍摄。
先附上我的github的代码,欢迎star!
https://github.com/zengdiqing1994/Highway_violation_detection/blob/master/carlane_detct.ipynb
import matplotlib.image as mplimg
img = mplimg.imread('goodimg.jpg')
1.灰度图转换
我们都知道一般图像都是RGB图像,在计算机看来就是数组,转化为灰度图,可以直接将图像RGB值相加再除以255,而opencv中有专门的函数来解决
cv2.cvtColor(img, cv2.COLOR_BGR2GRAY)
同时需要注意一点,从RGB到灰度图像本质上是建立了一个映射函数。对于确立好的映射函数,我们总能找到RGB空间中不同的点映射之后得到的点却基本相同。理由也很简单,从3通道到1通道肯定伴随着信息的损失。解决办法是不固定映射函数,根据图片做动态的映射函数。
2.高斯平滑
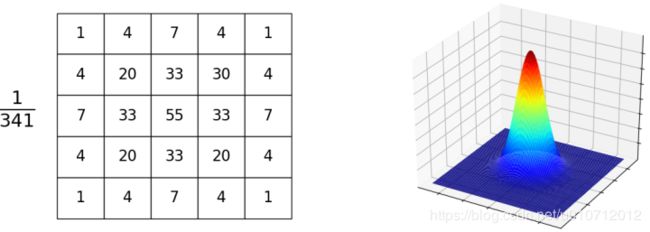
原理:重新计算图片中每个点的值,计算的时候取该点与周围点的加权平均,权重符合高斯分布。
作用:降低图片噪声和减少细节(增强图片在不同scale下的structure),并保留边界。同时Gauss FIlter是一种低通滤波器,只允许低频部分通过,限制高频部分(例如像素值剧烈升高或降低的噪点)。
效果:像通过半透明的玻璃看图片一样。
下图左侧展示了一个kernel_size = 5的Gaussian Filter,55是高斯分布的中心点,341是网格中所有值的和。假设网格矩阵为Q,图片为I,新图片为I’,则:
blur_ksize = 5  # Gaussian blur kernel size
blur_gray = cv2.GaussianBlur(gray, (blur_ksize, blur_ksize), 0, 0)
3.Canny 边缘检测
3.1高斯模糊
我们上面其实已经做过了高斯模糊,但是这里再做一次。
3.2计算梯度
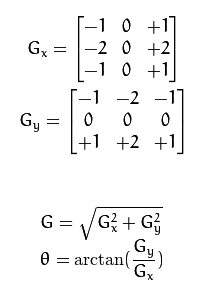
边缘检测的本质是计算图片在每个点的梯度(像素值的变化情况),变化值越大表明是边缘的概率越高。 计算梯度的时候使用了卷积,相关计算如下(方向约成【0、45、90、135】之间):
3.3非极大抑制
计算完梯度后,需要进行thin the edge。方法是将每个像素点的梯度值与梯度方向(上面那个 θ \theta θ的公式)上的两个点进行比较,当且仅当这个点的梯度值最大才保留,否则舍弃。(例如梯度方向是0度,那么将当前梯度值与左右两边的梯度值进行比较,当且仅当当前梯度值最大才保留),所以叫非极大抑制。
3.4高低阈值输出二值图像
这些误标记的edge可能来自噪音或者颜色的变化。解决的办法是设置两个阈值low_threshold、high_threshold,当前point的梯度gradient与阈值的关系如下:
》gradient < low_threshold:丢弃
》gradient > high_threshold:保留
》low_threshold < gradient < high_threshold: 当且仅当其存在相连点的梯度大于high_threshold才保留
# Define our parameters for Canny and apply
low_threshold = 140
high_threshold = 430
edges = cv2.Canny(blur_gray, low_threshold, high_threshold)
注意这里的高低阈值都是因图片而异的,不过一般高阈值是低阈值的3倍左右。
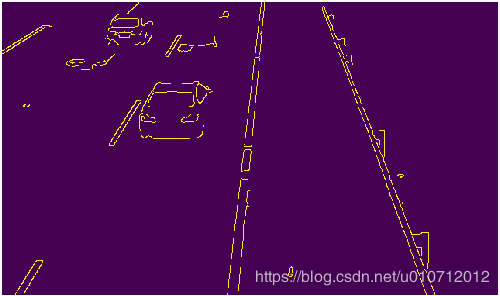
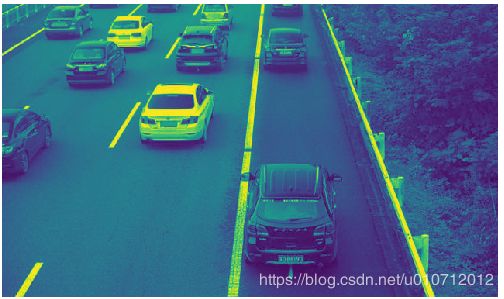
我也不知道背景为什么是紫的。。。
4.感兴趣区域选取(ROI Based Edge Filtering)
通过Canny进行边缘检测获得边缘后,会发现,获得的边缘不仅包括需要的车道线边缘,同时包括不需要的其他车道以及周围围栏的边缘。去掉这些边缘的办法是确定一个多边形的可视域,只保留可视域部分的边缘信息。其依据是camera相对无人机是固定的,无人机相对于车道的相对位置也基本固定(我们沿着固定的线路直线飞行),所以车道在camera中基本保持在一个固定区域内。
# Next we'll create a masked edges image using cv2.fillPoly()
mask = np.zeros_like(edges)
ignore_mask_color = 255

# This time we are defining a four sided polygon to mask
imshape = image.shape
vertices = np.array([[(30,canny.shape[0]),(220, 200), (400, 80), (860,canny.shape[0])]], dtype=np.int32)
cv2.fillPoly(mask, vertices, ignore_mask_color)
masked_edges = cv2.bitwise_and(edges, mask)
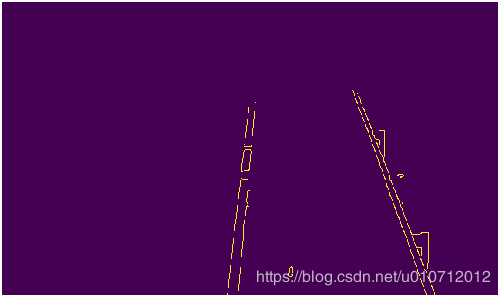
注意这里就是用黑色的多边形把我们不想看到的地方进行遮挡,这样我们就能得到稍微理想的区域,但是这里的vertices我还不是很清楚为什么这么取,是我试出来的。。。
5.Hough变换
最重要的东西总是要最后出场。霍夫变换一种特征提取技术,检测具有特定形状的物体,通常是直线、圆、椭圆。其原理是将原空间隐射到参数空间,在参数空间进行投票获得所需的图形。
我们普通图片是的线条可以表示为 y = m 0 x + b 0 y=m_{0}x+b_{0} y=m0x+b0,在霍夫(参数)空间就是一个点
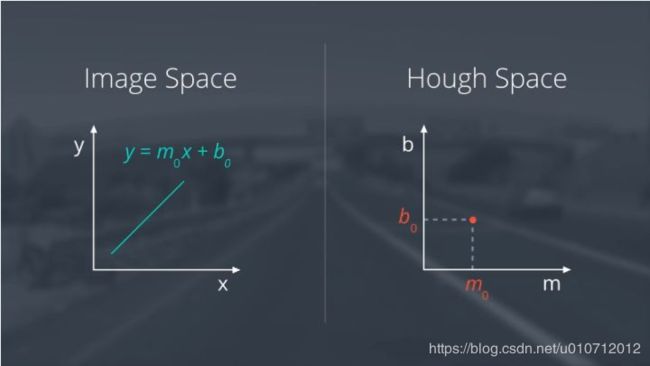
相反,图片上的点在霍夫空间就可以表示为线,我们要检测线条的话,就可以把图像上的每个点转换到霍夫空间去,找到霍夫空间上线条相交的点,就可以确定参数m, b
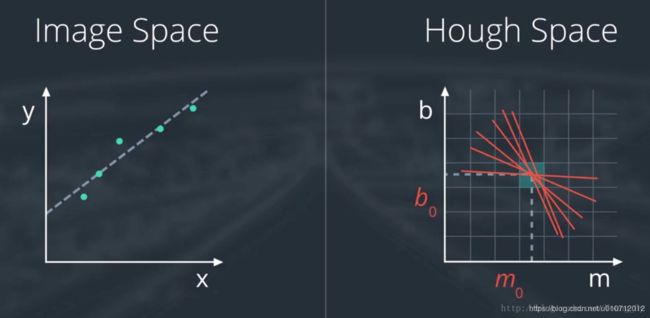
但是我们知道如果是垂直线的话,它的斜率不存在,那又怎么办呢?
这样就有了另一种直线表达方法 ρ 0 = x cos θ 0 + y sin θ 0 \rho_0=x\cos\theta_0+y\sin\theta_0 ρ0=xcosθ0+ysinθ0
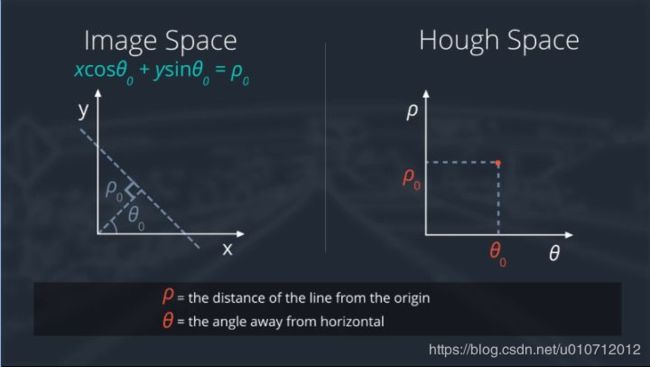
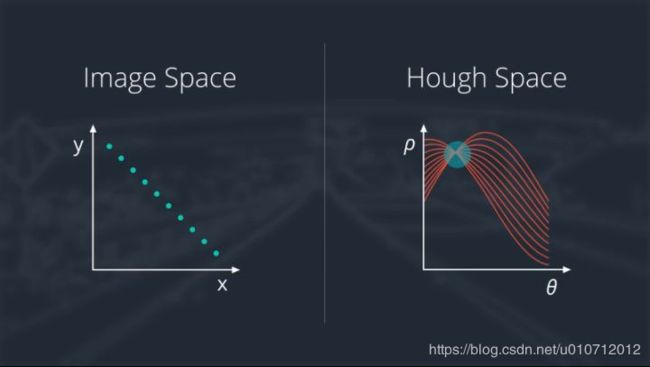
无论采用xy坐标还是极坐标,原空间的点都对应参数空间的曲线,原空间的直线都对应着参数空间中曲线的交点。如下图所示,可以根据在参数空间中每个grid相交点的出现次数寻找原空间中的直线。
意思就是,属于同一条直线上点在极坐标空间( ρ , θ \rho,\theta ρ,θ)必然在一个点上有最强的信号出现,根据此反算到平面坐标中就可以得到直线上各点的像素坐标,从而得到直线。
# Hough transform parameters
rho = 2
theta = np.pi / 180
threshold = 19
min_line_length = 60
max_line_gap = 20

def draw_lines(img, lines, color=[255, 0, 0], thickness=2):
    for line in lines:
        for x1, y1, x2, y2 in line:
            cv2.line(img, (x1, y1), (x2, y2), color, thickness)

def hough_lines(img, rho, theta, threshold,
                min_line_len, max_line_gap):
    lines = cv2.HoughLinesP(img, rho, theta, threshold, np.array([]),
                          minLineLength=min_line_len,
                          maxLineGap=max_line_gap)
    line_img = np.zeros((img.shape[0], img.shape[1], 3), dtype=np.uint8)
    draw_lines(line_img, lines)
    return line_img

line_img = hough_lines(roi, rho, theta, threshold,
                       min_line_length, max_line_gap)
plt.imshow(line_img)
plt.axis('off')
plt.show()
下面是函数HoughLinessP的api
Python: cv2.HoughLinesP(image, rho, theta, threshold[, lines[, minLineLength[, maxLineGap]]]) → lines
Parameters:
image – 8-bit, single-channel binary source image. The image may be modified by the function.
lines – Output vector of lines. Each line is represented by a 4-element vector (x_1, y_1, x_2, y_2) , where (x_1,y_1) and (x_2, y_2) are the ending points of each detected line segment.
rho – Distance resolution of the accumulator in pixels.
theta – Angle resolution of the accumulator in radians.
threshold – Accumulator threshold parameter. Only those lines are returned that get enough votes ( >\texttt{threshold} ).
minLineLength – Minimum line length. Line segments shorter than that are rejected.
maxLineGap – Maximum allowed gap between points on the same line to link them.
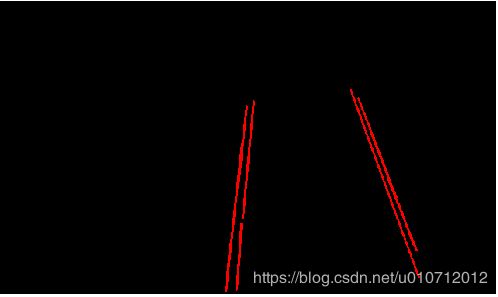
6.线条提取与线条拟合
def weighted_img(img, initial_img, α=0.7, β=1., λ=0.):
    """
    `img` is the output of the hough_lines(), An image with lines drawn on it.
    Should be a blank image (all black) with lines drawn on it.

    `initial_img` should be the image before any processing.

    The result image is computed as follows:

    initial_img * α + img * β + λ
    NOTE: initial_img and img must be the same shape!
    """
    return cv2.addWeighted(image, α, line_img, β, λ)
mix = weighted_img(line_img, image, α=0.7, β=1., λ=0.)
plt.imshow(mix)
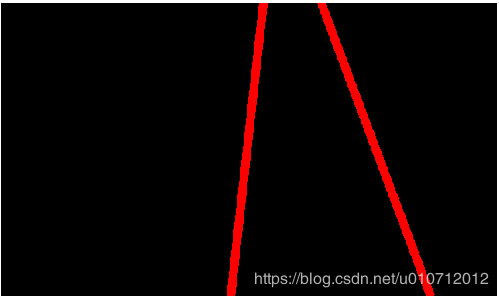
下面是通过求得线条的斜率判断是左车道线还是右车道线。进而把线条给拟合补全了
def linear_fit(x, a, b):
    return a * x + b

def draw_lines(img, lines, color=[255, 0, 0], thickness=10):#thickness越大,拟合的线条越粗
    right_x, right_y, left_x, left_y = [], [], [], []
    for line in lines:
        for x1, y1, x2, y2 in line:
            if ((y2 - y1) / (x2 - x1)) < 0:
                "right_line"
                right_x.append(x1)
                right_x.append(x2)
                right_y.append(y1)
                right_y.append(y2)
            elif ((y2 - y1) / (x2 - x1)) > 0:
                "left_line"
                left_x.append(x1)
                left_x.append(x2)
                left_y.append(y1)
                left_y.append(y2)

    right_a, right_b = optimize.curve_fit(linear_fit, np.array(right_x), np.array(right_y))[0]
    right_x1 = int((img.shape[0] - right_b) / right_a)
    right_y1 = img.shape[0]
    right_x2 = int((0 - right_b) / right_a)
    right_y2 = 0
    cv2.line(img, (right_x1, right_y1), (right_x2, right_y2), color, thickness)

    left_a, left_b = optimize.curve_fit(linear_fit, np.array(left_x), np.array(left_y))[0]
    left_x1 = int((img.shape[0] - left_b) / left_a)
    left_y1 = img.shape[0]
    left_x2 = int((0 - left_b) / left_a)
    left_y2 = 0
    cv2.line(img, (left_x1, left_y1), (left_x2, left_y2), color, thickness)
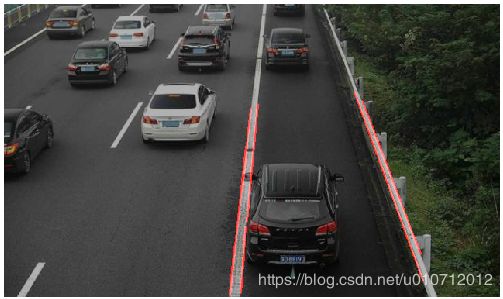
最后混合起来得到:

应急车道貌似就已经出来了~接下来就应该按照流程图来看应该要分析车辆的驾驶轨迹了。
参考文章:https://zhuanlan.zhihu.com/p/31623107
https://zhuanlan.zhihu.com/p/25354571

