netty 4.0.24版本Direct Memory Leak
现象
![]()
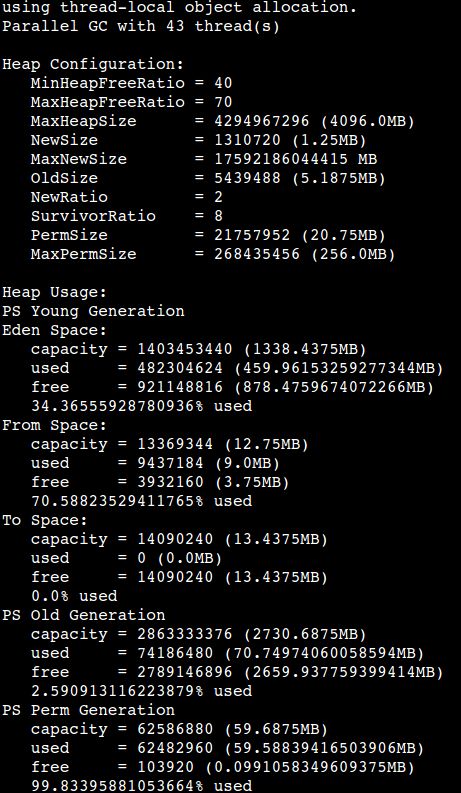
top显示常驻内存已经达到14G,而JVM本身的内存占用不高 -XMX 配置的是4096M.
分析
jmap -heap pid
jvm本身是没有问题的,而且应用表现也没有什么异常,但机器的内存已经占用很高,触发了机器监控的
内存报警.因为这个应用使用了netty,因为初步分析应该是有Direct Memory 没有回收处理。
采用pmap 查看进程内存情况
pmap -x pid
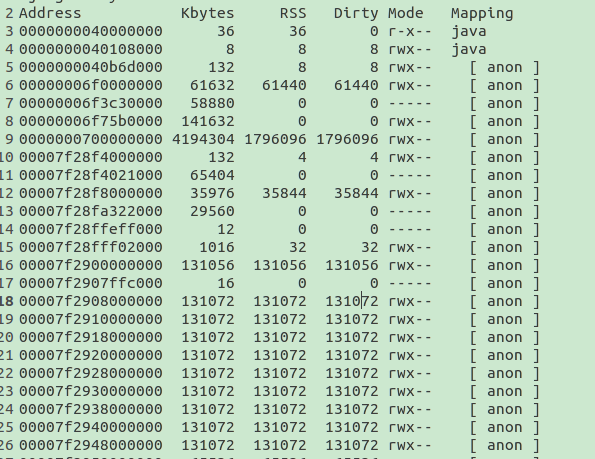
发现有大量的131072k 即128M。这样的内存地址有77个,应该这就是为什么内存一直高的原因了。
接着找到是谁怎么创建的这些堆外内存,首先怀疑的重点对象就是netty了。netty 这个高性能的nio框架
会申请堆外内存。但不能去全盘看netty的源码,这不太可能,所以只能先看看这些内存里面是存的是什
么东西,看看能否有什么线索。采用gdb这个工具来尝试一把
gdb --pid pid
然后执行
dump binary memory result.bin 0x00007f2908000000 0x00007f2910000000
会有一个result.bin的文件,然后通过hexdump 进行查看发现如下数据

内存放的大量的
Error while read (...): Connection reset by peer.
这个就是解决问题的突破点了
定位
来怎么来定位是netty哪块代码执行会导致这样的大量的堆外内存了,根据其存在的字符串分析应该是
在读取数据的时候发送断连接断掉了。查看netty源码,checkout 4.0 reset到4.0.24 final版本
全文search Error while read (…): Connection reset by peer。然后在io_netty_channel_epoll_Native.c中看到如下代码
jint read0(JNIEnv * env, jclass clazz, jint fd, void *buffer, jint pos, jint limit) {
    ssize_t res;
    int err;
    do {
        res = read(fd, buffer + pos, (size_t) (limit - pos));
        // Keep on reading if we was interrupted
    } while (res == -1 && ((err = errno) == EINTR));

    if (res < 0) {
        if (err == EAGAIN || err == EWOULDBLOCK) {
            // Nothing left to read
            return 0;
        }
        if (err == EBADF) {
            throwClosedChannelException(env);
            return -1;
        }
        throwIOException(env, exceptionMessage("Error while read(...): ", err));
        return -1;
    }


void throwIOException(JNIEnv *env, char *message) {
    (*env)->ThrowNew(env, ioExceptionClass, message);
}
问题很可能就是在ThrowNew这个异常这里了 google下,发现如下
fixing small leak on exception on the transport-epoll-native allocation
Motivation:
the JNI function ThrowNew won’t release any allocated memory.
The method exceptionMessage is allocating a new string concatenating 2 constant strings
What is creating a small leak in case of these exceptions are happening.
Modifications:
Added new methods that will use exceptionMessage and free resources accordingly.
I am also removing the inline definition on these methods as they could be reused by
other added modules (e.g. libaio which should be coming soon)
Result:
No more leaks in case of failures.
同时在netty 的issuse中也能找到对应的记录但作者似乎说这是个优化改进
解决
出现这个问题的场景是在开启epoll而且有特别多的这种connection reset的现象
解决就很简单了升级netty版本
其他
在分析解决这个问题的过程中google发现一篇帖子,现象和我遇到的场景很像
地址 作者通过优化glibc的环境变量能优化一些堆外内存的占用,但个人觉得这个应该不是解决问题的根本点
java进程消耗内存大于xmx配置值情况
- Garbage collection. As you might recall, Java is a garbage-collected language. In order for the garbage collector to know which objects are eligible for collection, it needs to keep track of the object graphs. So this is one part of the memory lost to this internal bookkeeping. G1 is especially known for its excessive appetite for additional memory, so be aware of this.
- JIT optimization. Java Virtual Machine optimizes the code during runtime. Again, to know which parts to optimize it needs to keep track of the execution of certain code parts. So again, you are going to lose memory
- Off-heap allocations. If you happen to use off-heap memory, for example while using direct or mapped ByteBuffers yourself or via some clever 3rd party API then voila – you are extending your heap to something you actually cannot control via JVM configuration
- JNI code. When you are using native code, for example in the format of Type 2 database drivers, then again you are loading code in the native memory.
- Metaspace. If you are an early adopter of Java 8, you are using metaspace instead of the good old permgen to store class declarations. This is unlimited and in a native part of the JVM.