python_matplotlib绘图初步学习
maplotlib 绘图
一、基本绘图
- 首先需要导入绘图工具以及numpy
import matplotlib.pyplot as plt
import numpy as np
- 绘制一条直线与二次曲线
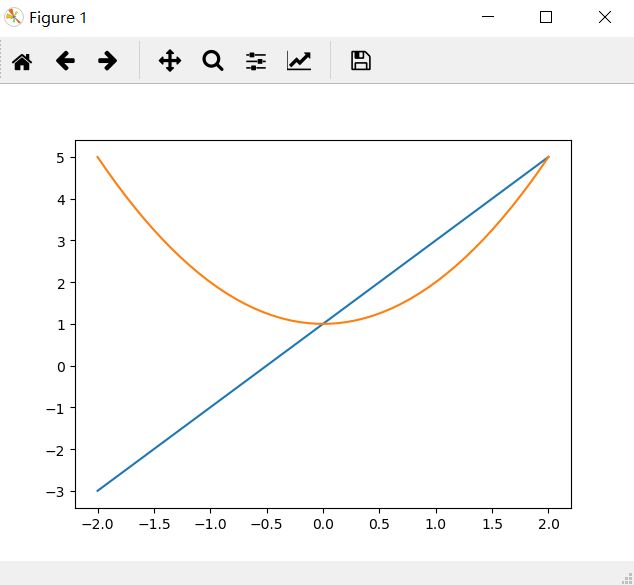
x = np.linspace(-2, 2, 50)    # -2到2之间的50个点 均匀选取
y1 = 2 * x + 1                # 直线方程  y1 也是50个点
y2 = x ** 2 + 1               # 直线方程  y2 也是50个点
#创建一幅图
plt.figure()
plt.plot(x, y1)               #绘制直线
plt.plot(x, y2)               #绘制曲线
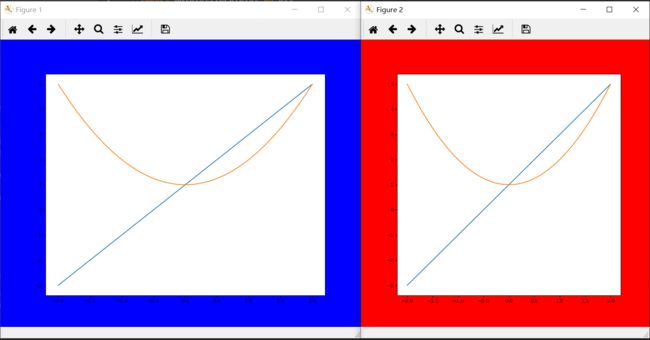
1. figure()
#  figsize=(10,8) 窗口大小
#  dpi=80         图像的分辨率
#  facecolor='b' 背景的颜色
plt.figure(figsize=(10, 8), dpi=80,facecolor='b')
plt.figure(figsize=(8, 8), dpi=80,facecolor='r')
2. plt.plot()
- 绘制直线
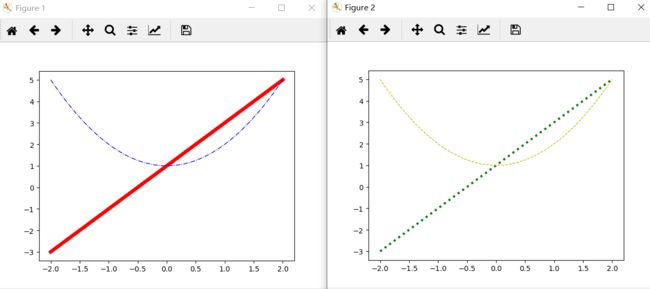
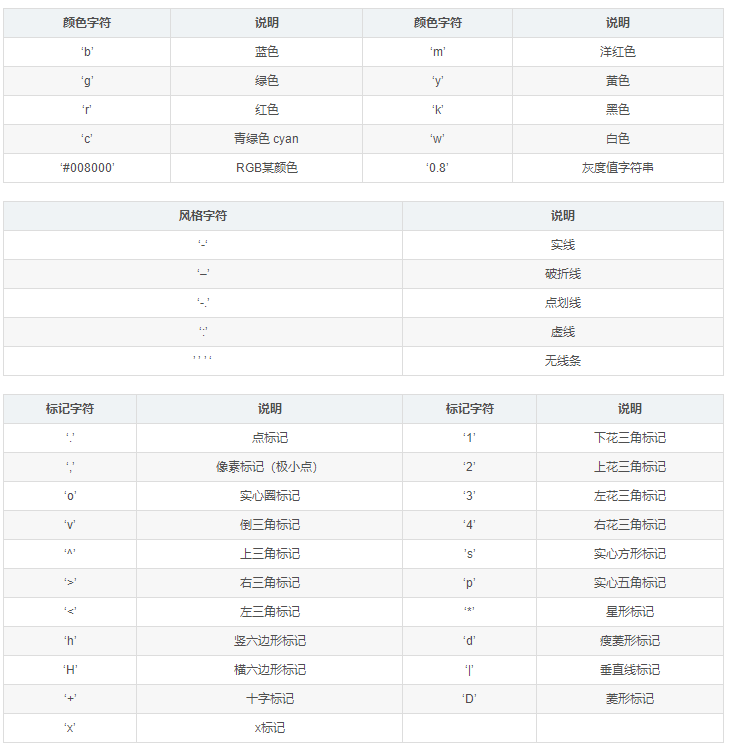
# color = 'r'         颜色
# linewidth = 5       线宽
# linestyle = '-'     线类型
plt.plot(x, y1,color = 'r',linewidth = 5,linestyle = '-')    #实线
plt.plot(x, y2,color = 'b',linewidth = 1,linestyle = '-.')   #点划线
plt.plot(x, y1, color='g', linewidth=3, linestyle=':')       #虚线
plt.plot(x, y2, color='y', linewidth=1, linestyle='--')      #破折线
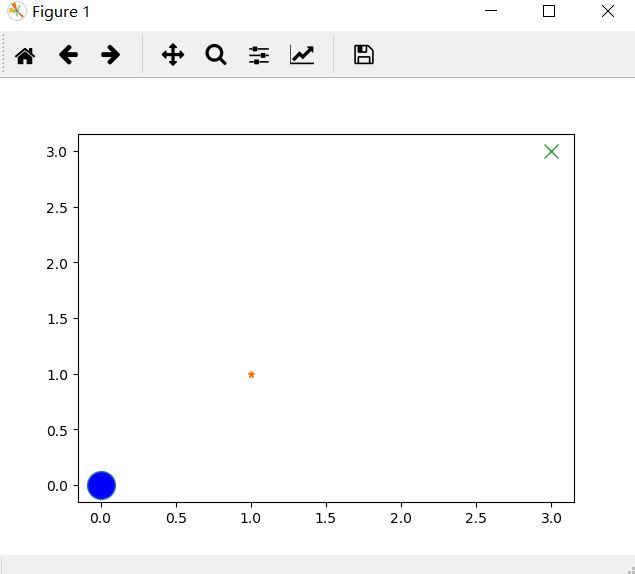
- 绘制点
#  marker='o'           标记类型
#  markerfacecolor='b'  标记颜色
#  markersize=20        标记大小
plt.plot(0, 0, marker='o', markerfacecolor='b', markersize=20)
plt.plot(1, 1, marker='*', markerfacecolor='r', markersize=5)
plt.plot(3, 3, marker='x', markerfacecolor='y', markersize=10)
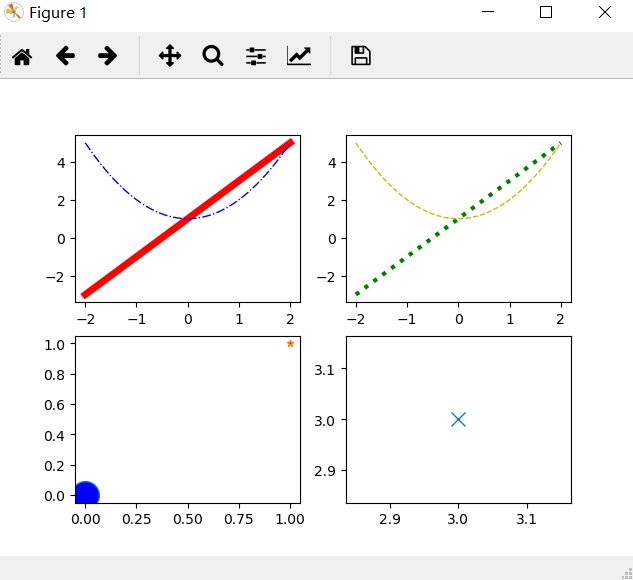
3.plt.subplot()
同个窗口内的多幅图像
plt.subplot(221)
plt.plot(x, y1,color = 'r',linewidth = 5,linestyle = '-')
plt.plot(x, y2,color = 'b',linewidth = 1,linestyle = '-.')
plt.subplot(222)
plt.plot(x, y1, color='g', linewidth=3, linestyle=':')
plt.plot(x, y2, color='y', linewidth=1, linestyle='--')
plt.subplot(223)
plt.plot(0, 0, marker='o', markerfacecolor='b', markersize=20)
plt.plot(1, 1, marker='*', markerfacecolor='r', markersize=5)
plt.subplot(224)
plt.plot(3, 3, marker='x', markerfacecolor='y', markersize=10)
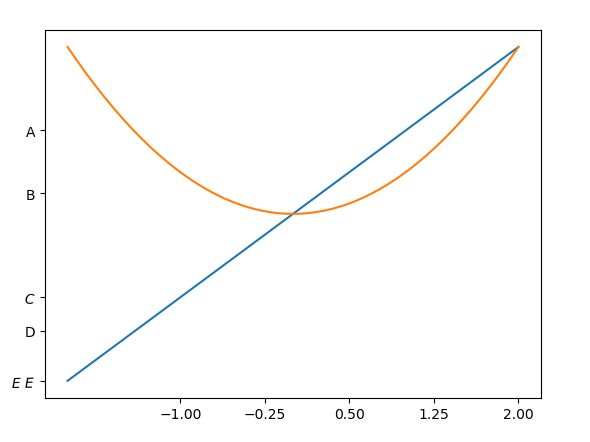
4. 重新定义坐标
# 一种方式,直接用新坐标替换
# 第二种方式 替换成文字
new_ticks = np.linspace(-1,2,5)
plt.xticks(new_ticks)
plt.yticks([-3,-1.8,-1,1.5,3],[r'$E\ E$','D',r'$C$','B','A'])
#  r'$E\ E$'  $$ 显示字体更标准  空格前必须加\
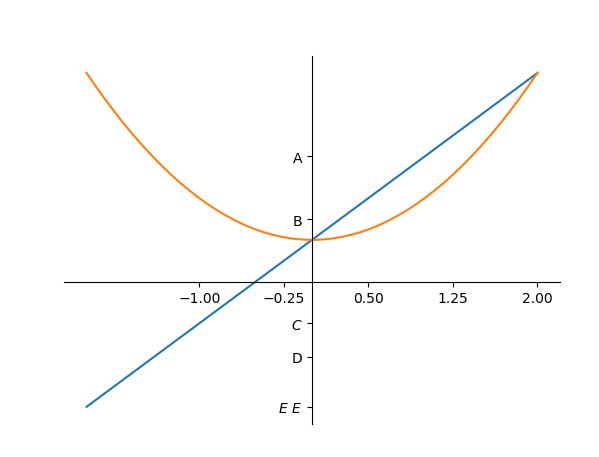
5. 移动坐标轴
# 移动坐标轴 ax 就是整张图
ax = plt.gca()                      #获取整张图
ax.spines['right'].set_color('none')#右边的轴设置成没有
ax.spines['top'].set_color('none')
ax.xaxis.set_ticks_position('bottom')
ax.yaxis.set_ticks_position('left')
# 设置x轴的位置在 y = 0处
ax.spines['bottom'].set_position(('data',0))
ax.spines['left'].set_position(('data',0))
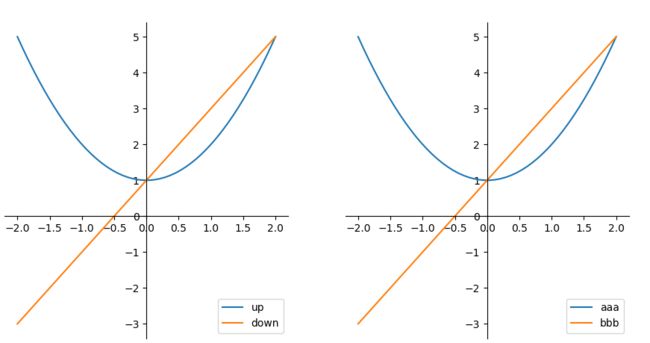
6. 增加标注
#方式一 在plot中添加label
plt.plot(x, y2,label = 'up')
plt.plot(x, y1,label = 'down')
# # 自动增加标注  loc = 'best' 'upper right'
plt.legend()

#方式二 定义plot名称  在legend中定义标签(推荐)
line1, = plt.plot(x, y2)
line2, = plt.plot(x, y1)
plt.legend(handles = [line1,line2,], labels= ['aaa','bbb'],loc = 'best')
二、高级绘图
2.1 动画制作GIF
def sintest1():
    fig,ax = plt.subplots()
    plt.xlim(-2 * np.pi * 2, 2 * np.pi * 2)
    plt.ylim(-1.1,1.1)
    x = np.arange(0,2*np.pi,0.05)
    line, = ax.plot(x,np.sin(x))
    line2, = ax.plot(x,np.cos(x))
    text_pt = plt.text(0, 0, '', fontsize=10,color = 'r')
    text_pt2 = plt.text(0, 0, '', fontsize=10, color='b')
    ax = plt.gca()
    ax.spines['right'].set_color('none')  # 右边的轴设置成没有
    ax.spines['top'].set_color('none')
    ax.xaxis.set_ticks_position('bottom')
    ax.yaxis.set_ticks_position('left')
    # 设置x轴的位置在 y = -1处
    ax.spines['bottom'].set_position(('data', 0))
    ax.spines['left'].set_position(('data', 0))
    def animate(i):
        # plt.xlim(0, 2*np.pi*i/100)
        c = i-200
        x = np.arange(-4*np.pi,2*np.pi*c/100,0.05)
        line.set_xdata(x)
        line.set_ydata(np.sin(x))
        text_pt.set_position((2*np.pi*c/100, np.sin(2*np.pi*c/100)))
        text_pt.set_text("x=%.3f, y=%.3f" % (2*np.pi*c/100, np.sin(2*np.pi*c/100)))

        line2.set_xdata(x)
        line2.set_ydata(np.cos(x))
        text_pt2.set_position((2*np.pi*c/100, np.cos(2*np.pi*c/100)))
        text_pt2.set_text("x=%.3f, y=%.3f" % (2*np.pi*c/100, np.cos(2*np.pi*c/100)))

        # line.set_xdata(x)
        # line.set_ydata(x)
        return line,text_pt,line2,text_pt2
    def init():
        line.set_ydata(np.sin(x))
        line2.set_ydata(np.cos(x))
        return line,line2

    ani = animation.FuncAnimation(fig=fig,func= animate,frames=400,init_func=init,interval=30,blit=True )
    # ani.save('sin_test3.gif', writer='pillow', fps=10)
    plt.show()
