数据可视化之cytoscape.js
因为数据要展示双向关系,最终选用了cytoscape.js。
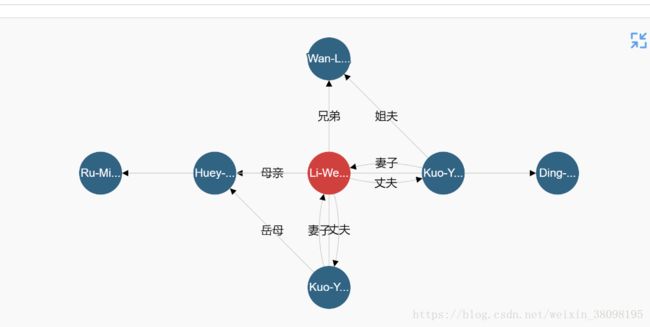
效果如图,echarts只能显示单项数据关系。
据我理解,这个插件分两种,一种是基于jquery的,另一种是原声的。
基于jquery是加在jquery对象上的。因为基于jquery的无法在线上显示关系。最终选择了原生
 cy = cytoscape({
    container: document.getElementById('echart'),//容器名字
    boxSelectionEnabled: false,
    autounselectify: true,

   style: cytoscape.stylesheet()
        .selector('node')//节点样式
        .css({
            'content': 'data(name)',
            'text-valign': 'center',
            'color': 'white',
            "height": 60,
            "width": 60,

            'text-outline-width': 2,
            'text-outline-color': '#316383',//颜色设置
            "background-color": "#316383",
            "label": "data(label)"
        })
        .selector('edge')//边线样式
        .css({
            'curve-style': 'bezier',
            "label": "data(label)",
            'target-arrow-shape': 'triangle',
            'target-arrow-color': 'black',
            'line-color': '#ccc',
            'width': 1
        })
        .selector(':selected')
        .css({
            'content': 'data(value)',
            'background-color': 'red',
            'line-color': 'red',
            'target-arrow-color': 'red',
            'source-arrow-color': 'red'
        })
        .selector('.background')
       .css({
           "text-background-opacity": 1,
           "text-background-color": "#ccc",
           "text-background-shape": "roundrectangle",
           "text-border-color": "#000",
           "text-border-width": 1,
           "text-border-opacity": 1
       })
       .selector('node[label="main"]')//主节点样式设置
       .css({
           "background-color": '#d0413e',
           'text-outline-width': 2,
           'text-outline-color': '#d0413e',

       })
        .selector('.faded')
        .css({
            'opacity': 0.25,
            'text-opacity': 0
        }),
  /*  style: [
        {
            selector: 'node',
            css: {
                'content': 'data(name)',
                'text-valign': 'center',
                'color': 'white',
                "height": 40,
                "width": 40,
                'text-outline-width': 2,
                'text-outline-color': '#6dce9e',
                "background-color": "#6dce9e",
                "label": "data(label)"
            }
        },

        {
            selector: 'edge',
            css: {
                'curve-style': 'bezier',
                "label": "data(label)",
                'target-arrow-shape': 'triangle',
                'target-arrow-color': '#ccc',
                'line-color': '#ccc',
                'width': 1
            }
        }
    ],*/
    elements: data.elements//

});
var layout = cy.layout({
    name: 'concentric',这是控制图形形状的
    fit:true,
    padding: 30, // the padding on fit
    startAngle:4/ 2 * Math.PI, // where nodes start in radians
    sweep: undefined, // how many radians should be between the first and last node (defaults to full circle)
    clockwise: true, // whether the layout should go clockwise (true) or counterclockwise/anticlockwise (false)
    equidistant: false, // whether levels have an equal radial distance betwen them, may cause bounding box overflow
    minNodeSpacing: 100 // min spacing between outside of nodes (used for radius adjustment)
});
layout.run();
这就是简单的初始化及一些配置。
详情可查看官方网站http://js.cytoscape.org/#cy.reset