关于mxGraph的学习小结
使用mxGraph的过程,也是学习的过程。刚开始甚至还番羽羽出去到stack overflow中提问题 至今也没人回答
一、个人理解: 在页面中应用mxGraph,主要有5个方法(方法名可以自定义,作用大致相同):
1.main(container) --声明graph的方法,大部分是固定写法
2.initGraph(param) --根据czlcGraph方法生成的节点加载进页面的方法,大部分是固定写法
3.initImages() --加载需要的图片,大部分是固定写法
4.czlcGraph() --根据业务需求,创建节点。自主方法
5.click_sj(cell) --根据业务需求,创建点击事件。自主方法
当然还有一些其他业务上的方法,比如页面加载时的查询方法、权限方法等等在此就不说了。
二、每个方法以在vue中的写法举例,jsp中写法类似
1.main(container)
container是盛放展示的div,用getElementById获得。
fun_main(container){
        var graph;
        let _this = this;
        if (!mxClient.isBrowserSupported()){
          mxUtils.error('浏览器不支持!', 200, false);
        }
        else{
          if (mxClient.IS_IE){
            new mxDivResizer(container);
          }
          graph = new mxGraph(container);
          graph.setEnabled(false);
          graph.addListener(mxEvent.CLICK, function(sender, evt){
            var cell = evt.getProperty('cell');
            if (cell != null){
              _this.click_sj(cell);//在此加载5.click_sj()的点击方法
            }
          });
          var track = new mxCellTracker(graph,'withe');
          track.mouseMove = function(sender,me){
            var cell = this.getCell(me);
            if(cell != null){
              //_this.move_sj(cell,me);
            }
          };
          var styles = graph.getStylesheet().getDefaultVertexStyle();
          //styles[mxConstants.STYLE_SHAPE] = mxConstants.SHAPE_ELLIPSE;
          styles[mxConstants.STYLE_PERIMETER] = mxPerimeter.EllipsePerimeter;
          styles[mxConstants.STYLE_GRADIENTCOLOR] = 'none';
          styles[mxConstants.STYLE_FILLCOLOR] = 'none';
          styles[mxConstants.STYLE_IMAGE_WIDTH] = 120;
          styles[mxConstants.STYLE_IMAGE_HEIGHT] = 34;
          styles[mxConstants.STYLE_ALIGN] = mxConstants.ALIGN_CENTER;
          styles[mxConstants.STYLE_VERTICAL_ALIGN] = mxConstants.ALIGN_TOP;
          styles[mxConstants.STYLE_IMAGE_ALIGN] = mxConstants.ALIGN_CENTER;
          styles[mxConstants.STYLE_IMAGE_VERTICAL_ALIGN] = mxConstants.ALIGN_MIDDLE;
          styles[mxConstants.STYLE_FONTCOLOR] = 'white';
          styles[mxConstants.STYLE_STROKECOLOR] = 'none';

          styles[mxConstants.STYLE_SPACING_TOP] = '40';
          styles[mxConstants.STYLE_SPACING_BOTTOM] = '0';
          styles[mxConstants.STYLE_LABEL_PADDING] = '0';
          styles[mxConstants.STYLE_NOEDGESTYLE] = true;
          this.graph = graph;
          this.initImages();//此方法是3.initImages()的执行方法
        }

      }
此方法主要是对container生成一张画布。其中引入3.initImages()、5.click_sj()方法。相当于在画布中预先加载好要显示的图片和点击方法。
2.initGraph(param)
param是在4.czlcGraph()中生成的需要显示的节点对象。因此czlzGraph方法需要在此方法之前执行
initGraph(param){
        var graph = this.graph;//此时就需要用到在1.main(container)中生成的画布graph。由于是在vue中,需要用this来获得全局graph
        graph.selectAll();
        graph.removeCells();
        var parent = graph.getDefaultParent();
        if(param==null)return;
        var maxNodeCount=7;
        var leftPos=40;
        var topPos=0;
        var radisF = 80;
        var radis=60;
        var w=118;
        var h=43;
        var wGap=40;
        var wGap2=60;
        var wGap3=130;
        var hGap=90;
        var hGap2=100;
        var hGap3=61;
        var hGap4=80;
        var vertex = '';
        graph.getModel().beginUpdate();
        try
        {
          let startInfo=param.start||{};
          let endInfo=param.end||{};
          let len=param.nodes&¶m.nodes.length||0;//{ toString:"11", data:startInfo.data,name:startInfo.nodes.name}
          let start = graph.insertVertex(parent, null, "", leftPos, topPos, radisF, radisF, 'sl');
          if(startInfo.nodes){
            for(let i=0;i0&&j%maxNodeCount==0){
                  topPos+=maxTopPos2+hGap4;
                  maxTopPos2=0;
                }
                var item=param.nodes[i].items[j];
                var left=leftPos+wGap2+wGap+j%maxNodeCount*wGap3;
                var doc2 = mxUtils.createXmlDocument();
                var node2 = doc2.createElement(item.name);
                var data2 = item.data;
                node2.setAttribute('hs', data2.hs);
                node2.setAttribute('czdw', data2.czdw);
                node2.setAttribute('czsj', data2.czsj);
                node2.setAttribute('dwlb', data2.dwlb);
                node2.setAttribute('xxfl', data2.xxfl);
                node2.setAttribute('xwlb', data2.xwlb);
                node2.setAttribute('czzj', data2.czzj);
                node2.setAttribute('zlly', data2.zlly);
                node2.setAttribute('qqdw', data2.qqdw);
                node2.setAttribute('xxzt', data2.xxzt);
                node2.setAttribute('glzlbh', data2.glzlbh);
                node2.setAttribute('qqdw', data2.qqdw);
                var n1=graph.insertVertex(parent, 'n_'+i+'_'+j, node2, left, topPos, w, h, item.shape);
                if(j==0){
                  var e3 = graph.insertEdge(parent, null, '', n0, n1, 'arrow;strokeWidth=2');
                }
                if(item.items){
                  for(var k=0;k0&&i%maxNodeCount==0){
                bottomPos+=hGap4;
              }
              var left2=leftPos+wGap2+wGap+i%maxNodeCount*wGap3;//{toString:"44",  data:node.data,name:node.name}
              var x1=graph.insertVertex(parent, null, (endInfo.nodes[i].name && (endInfo.nodes[i].name+"").indexOf("null")<0 )?endInfo.nodes[i].name:"", left2, bottomPos+(radisF-h)/2, w, h, node.shape);
              if(i==0){
                graph.insertEdge(parent, null, '', end, x1, 'arrow;strokeWidth=2');
              }
            }
          }
        }finally{
          graph.getModel().endUpdate();
        }
      }
此展示是三层循环,就像下图(此图只是逻辑关系,每一层的节点数是随意画的)
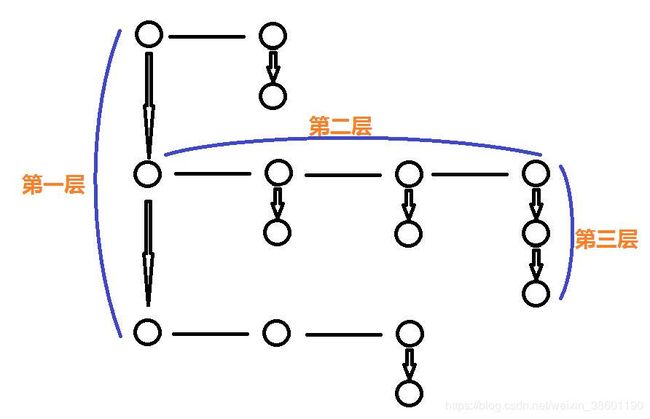
### 2.1
在第一层for循环(for-1)之前,先定义好start和end节点。
在for-1中,根据start的位置决定接下来第一层的第一个节点(n-1),此时第一层的节点中有子节点,则需要进行第二层for循环(for-2)。在for-2中的第一个节点是n1的第一个子节点(n-1-1),它的位置根据n-1的位置确定,代码是
var n1=graph.insertVertex(parent, 'n_'+i+'_'+j, node2, left, topPos, w, h, item.shape);
if(j==0){
  var e3 = graph.insertEdge(parent, null, '', n0, n1, 'arrow;strokeWidth=2');
}
其中 var e3 = graph.insertEdge(parent, null, ‘’, n0, n1, ‘arrow;strokeWidth=2’);中的n0就是n-1节点。具体可看上述代码。
以此类推,n-1-1节点的第一个子节点(n-1-1-1)在第三层for循环(for-3)创建。它的位置根据n-1-1确定。n-1-1-1的兄弟节点n-1-1-2、n-1-1-3、n-1-1-4、就这样我能写一天…都是根据自身的上一个节点来确定。
至于具体往下或者往左偏移多少,是用
topPos+=maxTopPos2+hGap4;
var left=leftPos+wGap2+wGap+j%maxNodeCount*wGap3;
这种来控制
### 2.2
像是
		var item=param.nodes[i].items[j];
        var left=leftPos+wGap2+wGap+j%maxNodeCount*wGap3;
		var doc2 = mxUtils.createXmlDocument();
		var node2 = doc2.createElement(item.name);
		var data2 = item.data;
		node2.setAttribute('hs', data2.hs);
		node2.setAttribute('czdw', data2.czdw);
		node2.setAttribute('czsj', data2.czsj);
		node2.setAttribute('dwlb', data2.dwlb);
		node2.setAttribute('xxfl', data2.xxfl);
		node2.setAttribute('xwlb', data2.xwlb);
		node2.setAttribute('czzj', data2.czzj);
		node2.setAttribute('zlly', data2.zlly);
		node2.setAttribute('qqdw', data2.qqdw);
		node2.setAttribute('xxzt', data2.xxzt);
		node2.setAttribute('glzlbh', data2.glzlbh);
		node2.setAttribute('qqdw', data2.qqdw);
		var n1=graph.insertVertex(parent, 'n_'+i+'_'+j, node2, left, topPos, w, h, item.shape);
这种生成一个node2的dom,然后注入到graph中是vue的写法。
而在jsp中,可以不要生成dom,直接传一个对象
fucntion(){
		...
		var item=param.nodes[i].items[j];
		var left=leftPos+wGap2+wGap+j%maxNodeCount*wGap3;
		var n1=graph.insertVertex(parent, 'n_'+i+'_'+j, {toString:backName,data:item.data,name:item.name}, left, topPos, w, h, item.shape);
		...
}

function backName(){
	return this.name
}
由于自己水平有限,发现从jsp中移植到vue中,直接传对象不起作用,后来查了官方文档,选择了dom的形式。如果有更好的方法,希望告知,在此感谢!
### 2.3
在mxGraph中 graph.insertVertex 和 graph.insertEdge是主要方法,负责展示flow中的各节点,并向节点中加载用于展示或者点击的数据。而数据的封装就是用到了node2,node3…或者在jsp中就是{toString:backName,data:item.data,name:item.name}这种形式。
这里的封装指的是一个节点的数据,多个节点要用循环实现。大概的效果像下面这样

至于某个位置该用哪张图片是**var n1=graph.insertVertex(parent, ‘n_’+i+’_’+j, {toString:backName,data:item.data,name:item.name}, left, topPos, w, h, item.shape);**中的item.shape来决定。假如item.shape的值是“wsh”,而initImages()中加载了此wsh图片,则此张图片就会显示在n1节点的位置
3.initImages()
此方法是加载所有能用到的图片。展示与否,用类似item.shape来控制。此方法是固定写法
function initImages(){
	var styles = {};
	styles[mxConstants.STYLE_SHAPE] = mxConstants.SHAPE_LABEL;
	styles[mxConstants.STYLE_PERIMETER] = mxPerimeter.RectanglePerimeter;
	styles[mxConstants.STYLE_IMAGE] = '../../../platform/graph/images/ddldbty.png';
	graph.getStylesheet().putCellStyle('ddldbty', styles);

	var styles = {};
	styles[mxConstants.STYLE_SHAPE] = mxConstants.SHAPE_LABEL;
	styles[mxConstants.STYLE_PERIMETER] = mxPerimeter.RectanglePerimeter;
	styles[mxConstants.STYLE_IMAGE] = '../../../platform/graph/images/dddsp.png';
	graph.getStylesheet().putCellStyle('dddsp', styles);

	var styles = {};
	styles[mxConstants.STYLE_SHAPE] = mxConstants.SHAPE_LABEL;
	styles[mxConstants.STYLE_PERIMETER] = mxPerimeter.RectanglePerimeter;
	styles[mxConstants.STYLE_IMAGE] = '../../../platform/graph/images/zldcl.png';
	graph.getStylesheet().putCellStyle('zldcl', styles);

	var styles = {};
	styles[mxConstants.STYLE_SHAPE] = mxConstants.SHAPE_LABEL;
	styles[mxConstants.STYLE_PERIMETER] = mxPerimeter.RectanglePerimeter;
	styles[mxConstants.STYLE_IMAGE] = '../../../platform/graph/images/wsh.png';
	graph.getStylesheet().putCellStyle('wsh', styles);
	...
}
当然也能设置一些别的参数,这里只做了图片的路径。
此方法就像是一个图片仓库,先把所有的图片加载进来,有符合条件的图片就展示。
下面两个是业务方法
4.czlcGraph()
此方法主要是根据自己的业务,生成initGraph(param)方法需要的param。
function czlcGraph(param){
    var param = {};
	...
}
其中具体的业务方法就不做展示了。最后的param结构类似
param = {
	start:{
		nodes:[
			{
				name:"hello",
				shape:"slaj"
			},
		],
		name:""
	},
	end:{
		nodes:[
			{
				name:"world",
				shape:"wpa"
			},
		],
		name:""
	},
	nodes:[
		{
			data:{},
			name:"",
			shape:"",
			items:[
				{
					name:"",
					data:{
						hs:"",
						xwlb:"",
						xxfl:"",
						czzj:"",
						xxzt:""
					},
					shape:"",
					items:[
						{
							data:{
								hs:"",
								xwlb:"",
								xxfl:"",
								czzj:"",
								xxzt:""
							},
							name:"",
							shape:"",
						},
						{},
						{}
					]
				},
				{},
				{}
			]
		},
		{},
		{}

	]
}
可以看到,因为param中有三层对象,所以在initGraph(param)中用了三层循环。
每一层中的每个对象都有shape、name、data。shape是图片名称。
name是图片下方的文字说明,data就是此图片代表的节点中绑定的数据。vue中用dom节点封装,jsp中直接用对象就行,主要作用是在点击此节点(图片)时,获得对应的数据。
比如点击此节点是打开详情页还是审核页面?具体操作还要看具体业务。点击事件的定义,就需要用到5.click_sj(cell)了
5.click_sj(cell)
此方法便是点击节点(图片)的方法。
其中的cell就是通过点击图片(节点)传来的节点对象,此对象中封装了此节点的信息。比如点击的cell是在哪一层、是详情节点还是审核节点等等。根据这些参数,来判断具体的业务。
结束
mxGraph的大概方法就是这些了。刚开始接触可能感觉比较复杂,不过当有了一点思路,就会好很多。
我建议从4.czlcGraph()和2.initGraph(param)入手,这两个方法也是最主要的方法。
可以先定义一个param,然后试一试intGraph的展示效果。有了一点点的效果(反馈),往下走就会好很多。
祝好运!