TensorBoard可视化
这里我们主要介绍了tensorboard可视化工具的管理,还有一些程序的代码,能够帮助我们很好的理解数据,辅助我们优化这里的程序。
一、初识TensorflBoard
#coding:utf-8
import tensorflow as tf
#定义一个简单的计算图,实现向量的加法操作
input1 = tf.constant([1.0,2.0,3.0],name="input1")
input2 = tf.Variable(tf.random_uniform([3]),name="input2")
output = tf.add_n([input1,input2],name="add")
##生成一个日志writer,并将当前的tensorflow计算法图写入日至。tensorflow提供了多种的写日志文件的API,
#在一些老的版本上使用的时tf.train.SummaryWriter 我这里使用的tensorflow1.13,版本更新注意
writer = tf.summary.FileWriter("./path/to/log",tf.get_default_graph())
writer.close()
#然后在命令窗口输入
tensorflowboard --logdir=./path/to/log
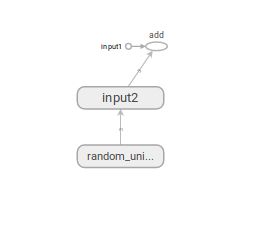
#接着在浏览器打开可以输入localhost:6006可以得到如下图的类似模板,可能由于模板的不同,我们得到的图像有所差别
二、Tensorboard图上的节点和命名空间的设置
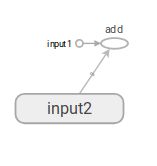
如何管理我们图上的节点,和我们的命名空间,下面的程序可以很好的展示我们我们成果,将我么的input2放在一个命名空间中
#coding:utf-8
import tensorflow as tf
#将输入定义放入各自的命名空间中,从而使得Tensorflow可以根据命名空间来整理可视化效果图上的节点
with tf.name_scope("input1"):
input1 = tf.constant([1.0,2.0,3.0],name="input1")
with tf.name_scope("input2"):
input2 = tf.Variable(tf.random_uniform([3]),name="input2")
output = tf.add_n([input1,input2],name="add")
writer = tf.summary.FileWriter("./path/to/log",tf.get_default_graph())
writer.close()
三、监控目标的可视化
如何将我们的程序在训练的时候每一点的信息进行描绘出来我们就需要进行监控指标的可视化,下面这段程序将手写数字训练过程的每一点的监控指标能够表现出来,其中将我们的生成的信息可视化这个使用到的函数可能由于版本的不同使用情况可能不同,我这里使用的时tensorflow1.13的版本:
#coding:utf-8
import tensorflow as tf
from tensorflow.examples.tutorials.mnist import input_data
from statsmodels.genmod.tests.test_glm_weights import weights
from idlelib.idle_test.test_config_name import name_dialog
SUMMARY_DIR = "./path/to/log"
BATCH_SIZE = 100
TRAIN_STEPS = 30000
'''生成变量监控信息并且定义生成监控信息日志的操作。其中var给出了需要记录的张量,name
给出了在可视化结果中显示的图表名称,这个名称一般与变量名一致'''
def variable_summaries(var,name):
'''将生成监控信息的操作放到同一个命名空间下'''
with tf.name_scope('summaries'):
'''通过tf.histogram_summary函数记录张量中元素的取值分布。对于给出的图表名称和张量,
tf.histogram_summary函数会生成一个Summary protocol buffer.将Summary写入日志文件之后,可以在HISTOGRAMS
栏目下看到对应的名称的图表。'''
tf.summary.histogram(name, var)
mean = tf.reduce_mean(var)
tf.summary.scalar('mean/'+name,mean)
'''计算变量的标准差,并定义生成其日志的操作'''
stddev = tf.sqrt(tf.reduce_mean(tf.square(var-mean)))
tf.summary.scalar('stddev/'+name, stddev)
'''生成全连接层神经网络'''
def nn_layer(input_tensor,input_dim,output_dim,layer_name,act=tf.nn.relu):
'''将同以层神经网络放在一个统一的命名空间下'''
with tf.name_scope(layer_name):
'''声明神经网络边上的权重,并且调用生成权重监控信息日志的函数'''
with tf.name_scope('weights'):
weights = tf.Variable(tf.truncated_normal([input_dim,output_dim],stddev=0.1))
variable_summaries(weights, layer_name + '/weights')
'''声明神经网络的偏执项,并且调用偏执项监控信息日志的函数'''
with tf.name_scope('biases'):
biases = tf.Variable(tf.constant(0.0,shape=[output_dim]))
variable_summaries(biases, layer_name + '/biases')
with tf.name_scope('Wx_plus_b'):
preactivate = tf.matmul(input_tensor,weights)+biases
'''记录神经网络输出节点在经过激活函数之前的分布'''
tf.summary.histogram(layer_name + '/pre_activations',preactivate )
activations = act(preactivate,name='activation')
'''记录神经网络输出节点在经过激活函数之后的分布。对于layer1,因为使用了ReLU函数作为激活函数,
所以所有小于0的值都被设成0.于是在激活后的layer1/activations图上所有的值都市大于0的。而对于layer2
因为没有使用激活函数,所以layer2/activations和layer2/pre_activations一样。'''
tf.summary.histogram(layer_name +'/activations',activations)
return activations
def main():
mnist = input_data.read_data_sets("./data",one_hot = True)
'''定义输入'''
with tf.name_scope('input'):
x = tf.placeholder(tf.float32, [None,784], name='input_x')
y_ = tf.placeholder(tf.float32,[None,10],name='input_y')
'''将输入向量还原成图片的像素矩阵,并且通过tf.image_summary函数定义将当前的图片信息写入日志的操作'''
with tf.name_scope('input_reshape'):
image_shaped_input = tf.reshape(x,[-1,28,28,1])
tf.summary.image('input',image_shaped_input,10)
hidden1 = nn_layer(x,784,500,'layer1')
y = nn_layer(hidden1,500,10,'layer2',act=tf.identity)
'''计算交叉商定义并且生成交叉商监控日志的操作'''
with tf.name_scope('cross_entropy'):
cross_entropy = tf.reduce_mean(tf.nn.softmax_cross_entropy_with_logits(logits=y,labels=y_))
tf.summary.scalar('cross entroy',cross_entropy)
with tf.name_scope('train'):
train_step = tf.train.AdamOptimizer(0.001).minimize(cross_entropy)
'''计算模型在当前给定数据上的正确率,并且定义生成正确率监控日志的操作。如果在sess.run时给定的数据时训练batch,那么我们得到的正确率就是在这个
训练batch上的正确率;如果给定的数据为验证或者测试数据,那么得到的正确率就是在当前模型在验证或者测试数据上的正确率'''
with tf.name_scope('accuracy'):
with tf.name_scope('correct_prediction'):
correct_prediction = tf.equal(tf.argmax(y,1),tf.argmax(y_,1))
with tf.name_scope('accuracy'):
accuracy = tf.reduce_mean(tf.cast(correct_prediction,tf.float32))
tf.summary.scalar('accuracy',accuracy)
'''和tensorflow中的其他操作类似,tf.summary.scalar,tf.summary.hitogram和tf.summary.image
函数都不会立即执行,需要通过sess.run来明确调用这些函数,因为程序中调用的写日志操作比较多,一一调用非常的麻烦,
所以tensorflow提供了tf.merge_all_summary来整理所有的日志生成操作,在tensorflow程序执行的过程中只需要运行这个操作就可以将代码中
定义的所有日志生成操作执行一次,从而将所有的日志写入文件'''
merged = tf.summary.merge_all()
with tf.Session() as sess:
'''初始化写日志writer,并将当前的tensorflow计算图写入日志'''
summary_writer = tf.summary.FileWriter(SUMMARY_DIR,sess.graph)
tf.global_variables_initializer().run()
for i in range(TRAIN_STEPS):
xs,ys = mnist.train.next_batch(BATCH_SIZE)
'''运行训练步骤以及所有的日志生成操作,得到这次运行的日志'''
summary, _ =sess.run([merged,train_step],feed_dict={x:xs,y_:ys})
'''将所有的日志写入文件,Tensorflow程序就可以拿到这次运行所对应的运行信息'''
summary_writer.add_summary(summary,i)
print i
summary_writer.close()
if __name__== '__main__':
main()
从我们的浏览器中可以看出个根据我们的迭代次数然后得到我们的变化曲线每一项都可以展开,然后得到我们相应的曲线。
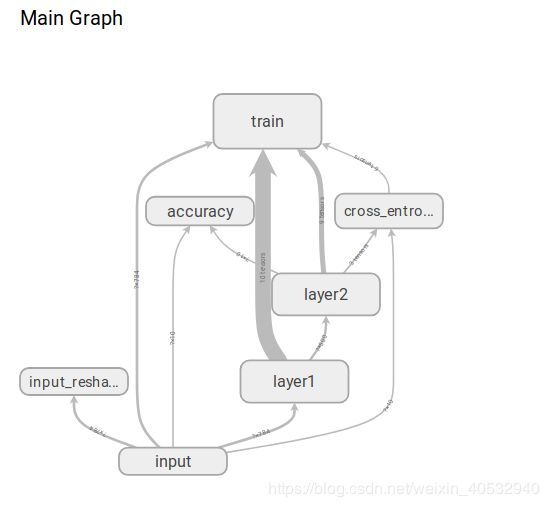
下面这张图可以得到我们张量数据的流动方式:
我们可以双击来查看每一个命名空间的内部的数据的流动方式:
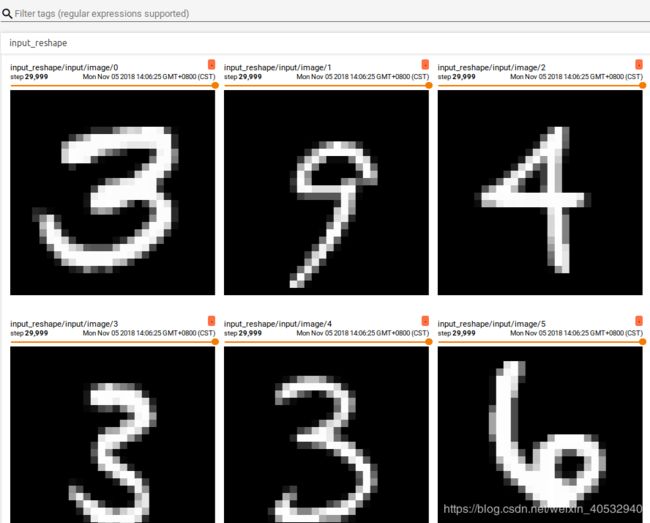
在我们的IMAGES栏目中可以看到Tensorflow程序中最新时哟个的训练或者测试图像:
TensorBoard的最后一栏提供了对于张量取值分布的可视化界面:


