信用卡欺诈检测案例实践(机器学习)
这是之前做过的项目实践,现在从头整理一下,再复习梳理清楚整个流程,信用卡欺诈检测,又叫异常检测。我们可以简单想一下,异常检测无非就是正常和异常,任务一个二分类任务,显然正常的占绝大部分,异常的只占很少的比例,我们要检测的就是这些异常的。明确了我们的任务后,我们要进行二分类的处理了。
简要说明一下我们拿到的数据集是经过银行初步、筛选拿到的数据集,因为基于银行数据会有相关隐私这个也是可以理解的,但这个不耽误我们跑模型和做预测
import pandas as pd
import matplotlib.pyplot as plt
import numpy as np
data = pd.read_csv("creditcard.csv")
data.head(6)
打印结果:
以上打印前6行的结果,从上我们可以观察到前面有一列时间序列对于我们的异常来说没啥大意义,amount序列数值浮动比较大待会要做标准化或归一化,因为计算机对于数值较大的值会误认为他的权重大,要把数据的大小尽量均衡,class这一列我们可以看到0占的百分比相当高,根据我们前面的分析,0是正常的样本,1为异常的
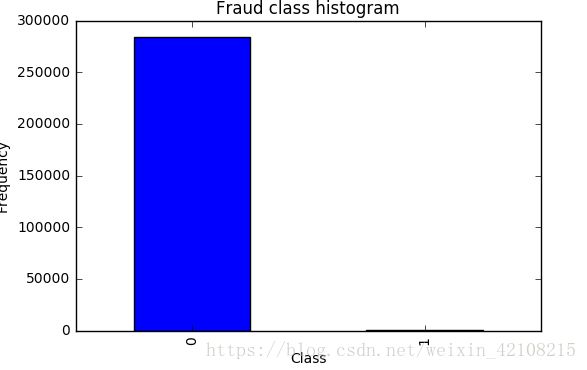
count_classes = pd.value_counts(data['Class'], sort = True).sort_index()#统计这一列中有多少不同的值,并排列出来
count_classes.plot(kind = 'bar')
plt.title("Fraud class histogram")
plt.xlabel("Class")
plt.ylabel("Frequency")
打印结果:
显然正负样本不均衡,可以通过上下采样调整样本分布均匀
画图的时候用pandas画一些简单的图表还是可以的,不一定非要用matplotlib
from sklearn.preprocessing import StandardScaler#调用预处理模块

data['normAmount'] = StandardScaler().fit_transform(data['Amount'].reshape(-1, 1))#标准化,并产生新的normamount
data = data.drop(['Time','Amount'],axis=1)#删除无用的所在的列
data.head()
下采样取数据
打印结果:
X = data.ix[:, data.columns != 'Class']#取出所有属性,不包含class的这一列
y = data.ix[:, data.columns == 'Class']#另y等于class这一列

# Number of data points in the minority class
number_records_fraud = len(data[data.Class == 1])#计算出class这一列一号元素有多少个
fraud_indices = np.array(data[data.Class == 1].index)#取出class这一列所有等于1的行索引

# Picking the indices of the normal classes
normal_indices = data[data.Class == 0].index#取出class这一列所有等于0的行索引

# Out of the indices we picked, randomly select "x" number (number_records_fraud)
random_normal_indices = np.random.choice(normal_indices, number_records_fraud, replace = False)#随机选择和1这个属性样本个数相同的0样本
random_normal_indices = np.array(random_normal_indices)#转换成numpy的格式

# Appending the 2 indices
under_sample_indices = np.concatenate([fraud_indices,random_normal_indices])#将正负样本拼接在一起

# Under sample dataset
under_sample_data = data.iloc[under_sample_indices,:]#下采样数据集

X_undersample = under_sample_data.ix[:, under_sample_data.columns != 'Class']#下采样数据集的数据
y_undersample = under_sample_data.ix[:, under_sample_data.columns == 'Class']#下采样数据集的label

# Showing ratio
print("Percentage of normal transactions: ", len(under_sample_data[under_sample_data.Class == 0])/len(under_sample_data))#打印正样本数目
print("Percentage of fraud transactions: ", len(under_sample_data[under_sample_data.Class == 1])/len(under_sample_data))#打印负样本数目
print("Total number of transactions in resampled data: ", len(under_sample_data))#打印总数量
打印结果:
Percentage of normal transactions:  0.5
Percentage of fraud transactions:  0.5
Total number of transactions in resampled data:  984
交叉验证
from sklearn.cross_validation import train_test_split#交叉验证模块引用训练集和数据集切分

# Whole dataset
X_train, X_test, y_train, y_test = train_test_split(X,y,test_size = 0.3, random_state = 0)#对整个训练集进行切分,testsize表示切分的测试集大小,state=0在切分时进行数据重洗牌 的标识位

print("Number transactions train dataset: ", len(X_train))
print("Number transactions test dataset: ", len(X_test))
print("Total number of transactions: ", len(X_train)+len(X_test))

# Undersampled dataset
X_train_undersample, X_test_undersample, y_train_undersample, y_test_undersample = train_test_split(X_undersample
                                                                                                   ,y_undersample
                                                                                                   ,test_size = 0.3
                                                                                                   ,random_state = 0)#对我们刚刚的下采样数据进行切分
print("")
print("Number transactions train dataset: ", len(X_train_undersample))
print("Number transactions test dataset: ", len(X_test_undersample))
print("Total number of transactions: ", len(X_train_undersample)+len(X_test_undersample))
打印结果:
Number transactions train dataset:  199364
Number transactions test dataset:  85443
Total number of transactions:  284807

Number transactions train dataset:  688
Number transactions test dataset:  296
Total number of transactions:  984
上面我们可以看到我们制造的样本均衡的数据比较小,在做测试是测试集不足以代表样本的整体性,所以真正测试时还是用原来数据集的测试集比较符合原始数据的分布
#Recall = TP/(TP+FN)
from sklearn.linear_model import LogisticRegression#调用逻辑回归模型
from sklearn.cross_validation import KFold, cross_val_score#调用k折交叉验证
from sklearn.metrics import confusion_matrix,recall_score,classification_report#引用混淆矩阵 ,召回率
def printing_Kfold_scores(x_train_data,y_train_data):
    fold = KFold(len(y_train_data),5,shuffle=False) #一第一个参数 训练集的长度,第二个参数为输入的几折交叉验证

    # Different C parameters
    c_param_range = [0.01,0.1,1,10,100]#传入选择正则化的参数

    results_table = pd.DataFrame(index = range(len(c_param_range),2), columns = ['C_parameter','Mean recall score'])
    results_table['C_parameter'] = c_param_range

    # the k-fold will give 2 lists: train_indices = indices[0], test_indices = indices[1]
    j = 0
    for c_param in c_param_range:
        print('-------------------------------------------')
        print('C parameter: ', c_param)
        print('-------------------------------------------')
        print('')#第一个for循环用来打印在每个正则化参数下的输出

        recall_accs = []
        for iteration, indices in enumerate(fold,start=1):

            # Call the logistic regression model with a certain C parameter
            lr = LogisticRegression(C = c_param, penalty = 'l1')#传入正则化参数

            # Use the training data to fit the model. In this case, we use the portion of the fold to train the model
            # with indices[0]. We then predict on the portion assigned as the 'test cross validation' with indices[1]
            lr.fit(x_train_data.iloc[indices[0],:],y_train_data.iloc[indices[0],:].values.ravel())

            # Predict values using the test indices in the training data
            y_pred_undersample = lr.predict(x_train_data.iloc[indices[1],:].values)

            # Calculate the recall score and append it to a list for recall scores representing the current c_parameter
            recall_acc = recall_score(y_train_data.iloc[indices[1],:].values,y_pred_undersample)
            recall_accs.append(recall_acc)
            print('Iteration ', iteration,': recall score = ', recall_acc)

        # The mean value of those recall scores is the metric we want to save and get hold of.
        results_table.ix[j,'Mean recall score'] = np.mean(recall_accs)
        j += 1
        print('')
        print('Mean recall score ', np.mean(recall_accs))
        print('')

    best_c = results_table.loc[results_table['Mean recall score'].idxmax()]['C_parameter']

    # Finally, we can check which C parameter is the best amongst the chosen.
    print('*********************************************************************************')
    print('Best model to choose from cross validation is with C parameter = ', best_c)
    print('*********************************************************************************')

    return best_c
best_c = printing_Kfold_scores(X_train_undersample,y_train_undersample)C parameter: 0.01 ------------------------------------------- Iteration 1 : recall score = 0.9452054794520548 Iteration 2 : recall score = 0.9178082191780822 Iteration 3 : recall score = 0.9830508474576272 Iteration 4 : recall score = 0.972972972972973 Iteration 5 : recall score = 0.9696969696969697 Mean recall score 0.9577468977515414 ------------------------------------------- C parameter: 0.1 ------------------------------------------- Iteration 1 : recall score = 0.8356164383561644 Iteration 2 : recall score = 0.863013698630137 Iteration 3 : recall score = 0.9491525423728814 Iteration 4 : recall score = 0.9324324324324325 Iteration 5 : recall score = 0.8939393939393939 Mean recall score 0.8948309011462019 ------------------------------------------- C parameter: 1 ------------------------------------------- Iteration 1 : recall score = 0.8356164383561644 Iteration 2 : recall score = 0.8767123287671232 Iteration 3 : recall score = 0.9661016949152542 Iteration 4 : recall score = 0.9459459459459459 Iteration 5 : recall score = 0.8939393939393939 Mean recall score 0.9036631603847762 ------------------------------------------- C parameter: 10 ------------------------------------------- Iteration 1 : recall score = 0.8493150684931506 Iteration 2 : recall score = 0.8767123287671232
Iteration  3 : recall score =  0.9661016949152542
Iteration  4 : recall score =  0.9459459459459459
Iteration  5 : recall score =  0.8939393939393939

Mean recall score  0.9064028864121736

-------------------------------------------
C parameter:  100
-------------------------------------------

Iteration  1 : recall score =  0.8493150684931506
Iteration  2 : recall score =  0.8767123287671232
Iteration  3 : recall score =  0.9661016949152542
Iteration  4 : recall score =  0.9594594594594594
Iteration  5 : recall score =  0.8939393939393939

Mean recall score  0.9091055891148763
评估标准:参考混淆矩阵
def plot_confusion_matrix(cm, classes,
                          title='Confusion matrix',
                          cmap=plt.cm.Blues):
    """
    This function prints and plots the confusion matrix.
    """
    plt.imshow(cm, interpolation='nearest', cmap=cmap)
    plt.title(title)
    plt.colorbar()
    tick_marks = np.arange(len(classes))
    plt.xticks(tick_marks, classes, rotation=0)
    plt.yticks(tick_marks, classes)

    thresh = cm.max() / 2.
    for i, j in itertools.product(range(cm.shape[0]), range(cm.shape[1])):
        plt.text(j, i, cm[i, j],
                 horizontalalignment="center",
                 color="white" if cm[i, j] > thresh else "black")

    plt.tight_layout()
    plt.ylabel('True label')
    plt.xlabel('Predicted label')
import itertools
lr = LogisticRegression(C = best_c, penalty = 'l1')
lr.fit(X_train_undersample,y_train_undersample.values.ravel())
y_pred_undersample = lr.predict(X_test_undersample.values)
# Compute confusion matrix
cnf_matrix = confusion_matrix(y_test_undersample,y_pred_undersample)
np.set_printoptions(precision=2)
print("Recall metric in the testing dataset: ", cnf_matrix[1,1]/(cnf_matrix[1,0]+cnf_matrix[1,1]))
# Plot non-normalized confusion matrix
class_names = [0,1]
plt.figure()
plot_confusion_matrix(cnf_matrix
, classes=class_names
, title='Confusion matrix')
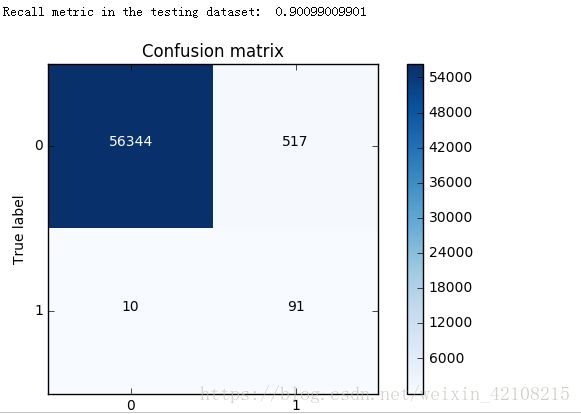
plt.show()lr = LogisticRegression(C = best_c, penalty = 'l1')
lr.fit(X_train_undersample,y_train_undersample.values.ravel())
y_pred = lr.predict(X_test.values)
# Compute confusion matrix
cnf_matrix = confusion_matrix(y_test,y_pred)
np.set_printoptions(precision=2)
print("Recall metric in the testing dataset: ", cnf_matrix[1,1]/(cnf_matrix[1,0]+cnf_matrix[1,1]))
# Plot non-normalized confusion matrix
class_names = [0,1]
plt.figure()
plot_confusion_matrix(cnf_matrix
, classes=class_names
, title='Confusion matrix')
plt.show()打印结果:
我们在做模型预测时,要基于业务层面去考虑,在此案例中我们我们把正常的样本预测成异常的出现8000多个,显然是不合适的,看来下采样方法效果也不是很好,那么我们接下里来调整逻辑回归的阈值来看下阈值
lr = LogisticRegression(C = 0.01, penalty = 'l1')
lr.fit(X_train_undersample,y_train_undersample.values.ravel())
y_pred_undersample_proba = lr.predict_proba(X_test_undersample.values)

thresholds = [0.1,0.2,0.3,0.4,0.5,0.6,0.7,0.8,0.9]

plt.figure(figsize=(10,10))

j = 1
for i in thresholds:
    y_test_predictions_high_recall = y_pred_undersample_proba[:,1] > i

    plt.subplot(3,3,j)
    j += 1

    # Compute confusion matrix
    cnf_matrix = confusion_matrix(y_test_undersample,y_test_predictions_high_recall)
    np.set_printoptions(precision=2)

    print("Recall metric in the testing dataset: ", cnf_matrix[1,1]/(cnf_matrix[1,0]+cnf_matrix[1,1]))

    # Plot non-normalized confusion matrix
    class_names = [0,1]
    plot_confusion_matrix(cnf_matrix
                          , classes=class_names
                          , title='Threshold >= %s'%i)
打印结果:
Recall metric in the testing dataset:  1.0
Recall metric in the testing dataset:  1.0
Recall metric in the testing dataset:  1.0
Recall metric in the testing dataset:  0.986394557823
Recall metric in the testing dataset:  0.931972789116
Recall metric in the testing dataset:  0.884353741497
Recall metric in the testing dataset:  0.836734693878
Recall metric in the testing dataset:  0.748299319728
Recall metric in the testing dataset:  0.571428571429
从这里看,通过调整逻辑回归的阈值,召回率大小还是有一定的浮动的
下面我们看看上采样的方法:
import pandas as pd
from imblearn.over_sampling import SMOTE#引用过采样的smote方法
from sklearn.ensemble import RandomForestClassifier
from sklearn.metrics import confusion_matrix
from sklearn.model_selection import train_test_split
credit_cards=pd.read_csv('creditcard.csv')

columns=credit_cards.columns
# The labels are in the last column ('Class'). Simply remove it to obtain features columns
features_columns=columns.delete(len(columns)-1)

features=credit_cards[features_columns]
labels=credit_cards['Class']
features_train, features_test, labels_train, labels_test = train_test_split(features,
                                                                            labels,
                                                                            test_size=0.2,
                                                                            random_state=0)
oversampler=SMOTE(random_state=0)
os_features,os_labels=oversampler.fit_sample(features_train,labels_train)
len(os_labels[os_labels==1])
os_features = pd.DataFrame(os_features)
os_labels = pd.DataFrame(os_labels)
best_c = printing_Kfold_scores(os_features,os_labels)
打印结果:
C parameter:  0.01
-------------------------------------------

Iteration  1 : recall score =  0.890322580645
Iteration  2 : recall score =  0.894736842105
Iteration  3 : recall score =  0.968861347792
Iteration  4 : recall score =  0.957595541926
Iteration  5 : recall score =  0.958430881173

Mean recall score  0.933989438728

-------------------------------------------
C parameter:  0.1
-------------------------------------------

Iteration  1 : recall score =  0.890322580645
Iteration  2 : recall score =  0.894736842105
Iteration  3 : recall score =  0.970410534469
Iteration  4 : recall score =  0.959980655302
Iteration  5 : recall score =  0.960178498807

Mean recall score  0.935125822266

-------------------------------------------
C parameter:  1
-------------------------------------------

Iteration  1 : recall score =  0.890322580645
Iteration  2 : recall score =  0.894736842105
Iteration  3 : recall score =  0.970454796946
Iteration  4 : recall score =  0.96014552489
Iteration  5 : recall score =  0.960596168431

Mean recall score  0.935251182603

-------------------------------------------
C parameter:  10
-------------------------------------------

Iteration  1 : recall score =  0.890322580645
Iteration  2 : recall score =  0.894736842105
Iteration  3 : recall score =  0.97065397809
Iteration  4 : recall score =  0.960343368396
Iteration  5 : recall score =  0.960530220596

Mean recall score  0.935317397966

-------------------------------------------
C parameter:  100
-------------------------------------------

Iteration  1 : recall score =  0.890322580645
Iteration  2 : recall score =  0.894736842105
Iteration  3 : recall score =  0.970543321899
Iteration  4 : recall score =  0.960211472725
Iteration  5 : recall score =  0.960903924995

Mean recall score  0.935343628474

*********************************************************************************
Best model to choose from cross validation is with C parameter =  100.0
lr = LogisticRegression(C = best_c, penalty = 'l1')
lr.fit(os_features,os_labels.values.ravel())
y_pred = lr.predict(features_test.values)

# Compute confusion matrix
cnf_matrix = confusion_matrix(labels_test,y_pred)
np.set_printoptions(precision=2)

print("Recall metric in the testing dataset: ", cnf_matrix[1,1]/(cnf_matrix[1,0]+cnf_matrix[1,1]))

# Plot non-normalized confusion matrix
class_names = [0,1]
plt.figure()
plot_confusion_matrix(cnf_matrix
                      , classes=class_names
                      , title='Confusion matrix')
plt.show()
打印结果:
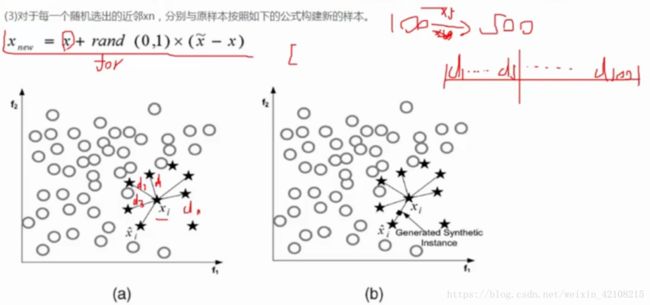
总结补充下SMOTE算法:


