练习——随机森林分类毒、可食用蘑菇数据集
假如我们在山上采蘑菇,为了避免食物中毒,需要采集那些有较大的置信度认为可食用的蘑菇,虽然这种办法会遗漏掉许多我们难以判断的蘑菇(实际是可食用的)。
对此,我们希望能找到那种能很好区分的特征,或者说区分度很大的特征,来避免危险,保证安全,所以我采用随机森林算法来实现目的。
毒蘑菇数据集是一个包含8123个样本的数据集,有22个特征,为菌盖颜色、菌盖形状、菌盖表面形状、气味、菌褶等,下图是网上找的示意图。

这些特征将蘑菇数据集分类为两类,为毒蘑菇和可食用的蘑菇, edible(可食用)有4208例,占总样本的51.8%;poisonous(毒蘑菇)有3916例,占48.2%。
数据预览
先查看一下数据的前10行
import numpy as np
import pandas as pd
import matplotlib.pyplot as plt
import matplotlib as mpl
import seaborn as sns
%matplotlib inline

mushrooms=pd.read_csv('mushroom.data')
mushrooms.columns=['class','cap-shape','cap-surface','cap-color','ruises','odor','gill-attachment','gill-spacing','gill-size','gill-color','stalk-shape','stalk-root','stalk-surface-above-ring','stalk-surface-below-ring','stalk-color-above-ring','stalk-color-below-ring','veil-type','veil-color','ring-number','ring-type','spore-print-color','population','habitat']
pd.set_option("display.max_columns",500) #让所有列都能加载出来
mushrooms.head(10)
#mushrooms.info()
mushrooms.describe()
绘制直方图
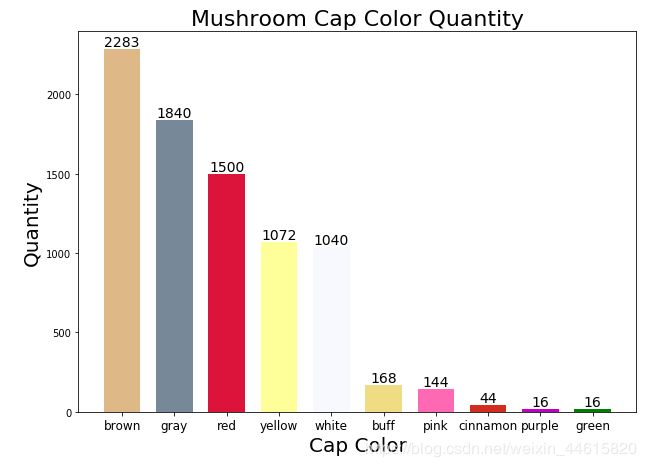
以菌盖的颜色为例,绘制直方图
cap_colors = mushrooms['cap-color'].value_counts() #计算各种颜色的数量
m_height = cap_colors.values.tolist()  #将数组转化为列表形式
cap_colors.axes
cap_color_labels = cap_colors.axes[0].tolist()  #将各颜色的名称作为横坐标
print(m_height)
print(cap_color_labels)
定义一个函数,该函数在直方图的每个bar上面附上具体的数值
def autolabel(rects,fontsize=14):
    for rect in rects:
        height = rect.get_height()
        ax.text(rect.get_x() + rect.get_width()/2, 1*height,'%d' % int(height),
                ha='center', va='bottom',fontsize=fontsize)
画图
ind = np.arange(10)  #因为有10个颜色,所以做十个bar
width = 0.7    #设置bar的宽度

#设置颜色
colors = ['#DEB887','#778899','#DC143C','#FFFF99','#f8f8ff','#F0DC82','#FF69B4','#D22D1E','#C000C5','g']
#设置画布大小
fig, ax = plt.subplots(figsize=(10,7))
#设置bar的具体参数
cap_colors_bars = ax.bar(ind, m_height , width, color=colors)

#设置横纵坐标轴和标题
ax.set_xlabel("Cap Color",fontsize=20)
ax.set_ylabel('Quantity',fontsize=20)
ax.set_title('Mushroom Cap Color Quantity',fontsize=22)
ax.set_xticks(ind)
ax.set_xticklabels(('brown', 'gray','red','yellow','white','buff','pink','cinnamon','purple','green'),
                  fontsize = 12)

#利用上面这个函数,在每个bar上面附上具体的数值
autolabel(cap_colors_bars)
plt.show()

可以看出在蘑菇届,棕、灰、红、黄、白的蘑菇占大多数,但是具体哪一种可以吃哪一种有毒还要继续分析。
#创建两个列表,分别为各颜色有毒蘑菇的数量和个颜色食用菌的数量
poisonous_cc = []
edible_cc = []

for capColor in cap_color_labels:
    size = len(mushrooms[mushrooms['cap-color'] == capColor].index) #各颜色蘑菇总数
    edibles = len(mushrooms[(mushrooms['cap-color'] == capColor) & (mushrooms['class'] == 'e')].index) #各颜色食用菌的数量
    edible_cc.append(edibles)
    poisonous_cc.append(size-edibles) #总减食用得到有毒的数量
print(edible_cc)
print(poisonous_cc)


width = 0.4
fig, ax = plt.subplots(figsize=(14,8))
edible_bars = ax.bar(ind, edible_cc , width, color='#FFB90F') #画食用菌的bars
#有毒菌在食用菌右侧移动width个单位
poison_bars = ax.bar(ind+width, poisonous_cc , width, color='#4A708B')

ax.set_xlabel("Cap Color",fontsize=20)
ax.set_ylabel('Quantity',fontsize=20)
ax.set_title('Edible and Poisonous Mushrooms Based on Cap Color',fontsize=22)
ax.set_xticks(ind + width / 2)
ax.set_xticklabels(('brown', 'gray','red','yellow','white','buff','pink','cinnamon','purple','green'),
                  fontsize = 12)
ax.legend((edible_bars,poison_bars),('edible','poisonous'),fontsize=17)
autolabel(edible_bars, 10)
autolabel(poison_bars, 10)
plt.show()

总得来说,鲜艳的蘑菇有毒的可能性还是较高的,比如红色和黄色,但其他颜色的蘑菇并非就是完全可食用,棕色和灰色的蘑菇都是很常见的,所以判断这些蘑菇有没有毒还需要和其他特征一起来综合判断。
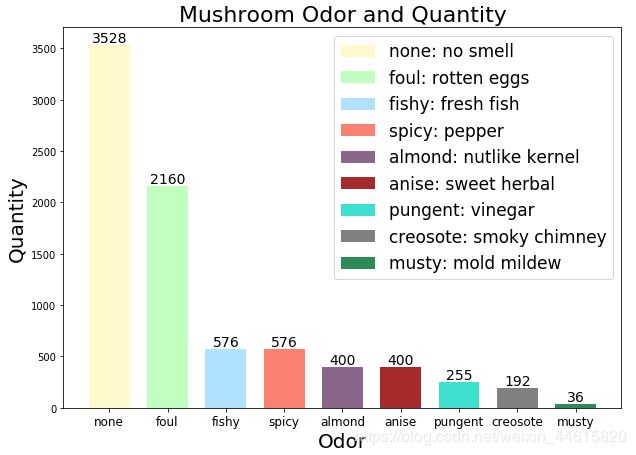
下面用同样的方法绘制一个蘑菇气味的bars


almond:杏仁味;anise:茴香味
所以可食用的蘑菇绝大部分是无味、杏仁味和茴香味的,其他奇奇怪怪气味的可以认为是有毒的,根据气味来分辨是一个很好的方法。
数据处理
将数据数字化
from sklearn.preprocessing import LabelEncoder
labelencoder=LabelEncoder()
for col in mushrooms.columns:
    mushrooms[col] = labelencoder.fit_transform(mushrooms[col])

mushrooms.head()
X=mushrooms.drop('class',axis=1) #Predictors
y=mushrooms['class'] #Response
#X.head()
这里采用用哑变量编码,为的是后面能更好的计算特征的各属性的重要性,并且避免数值变量分类时偏向于数值大的属性
X=pd.get_dummies(X,columns=X.columns,drop_first=True)
X.head()
构建模型
from sklearn.model_selection import train_test_split
X_train, X_test, y_train, y_test = train_test_split(X, y, test_size=0.3, random_state=1234)
#随机森林
from sklearn.ensemble import RandomForestClassifier
from sklearn.model_selection import GridSearchCV

RF_features= RandomForestClassifier()

#可以通过定义树的各种参数,限制树的大小,防止出现过拟合现象
parameters = {'n_estimators': [100,200,500],
              'criterion': ['gini'],
              'max_depth': range(5,10),
              'min_samples_split': [2,4,6,8],
              'min_samples_leaf': [2,4,6,8,10]
             }

#自动调参,通过交叉验证确定最优参数。
grid_RF = GridSearchCV(RF_features,parameters,cv=10,n_jobs=1)
grid_RF = grid_RF.fit(X_train,y_train)

RF_features = grid_RF.best_estimator_
RF_features.fit(X_train,y_train)

y_pred= RF_features.predict(X_test)
print(RF_features)
RandomForestClassifier(bootstrap=True, class_weight=None, criterion=‘gini’,
max_depth=8, max_features=‘auto’, max_leaf_nodes=None,
min_impurity_decrease=0.0, min_impurity_split=None,
min_samples_leaf=2, min_samples_split=2,
min_weight_fraction_leaf=0.0, n_estimators=100, n_jobs=1,
oob_score=False, random_state=None, verbose=0,
warm_start=False)
显示哪些特征对于区分可食用或有毒最为重要
importance=RF_features.feature_importances_
series=pd.Series(importance,index=X_train.columns)
plt.figure(figsize = (20,50))
series.sort_values(ascending=True).plot('barh')
plt.show()

![]()
前三个为无味、菌褶密集、杏仁味。
所以假如采蘑菇时,符合这三个特征的蘑菇可以有很大的置信度认为,这个蘑菇可以食用啦。
模型性能度量
report(y_test,y_test)
output:
Confusion Matrix:
 [[1264    0]
 [   0 1173]]
Accuracy: 1.0
Classification Report:
              precision    recall  f1-score   support

          0       1.00      1.00      1.00      1264
          1       1.00      1.00      1.00      1173

avg / total       1.00      1.00      1.00      2437
~~


