10-opencv-python-图像阀值
目录
一、简单阀值
二、自适应阀值
三、Otsu’s二值化
一、简单阀值
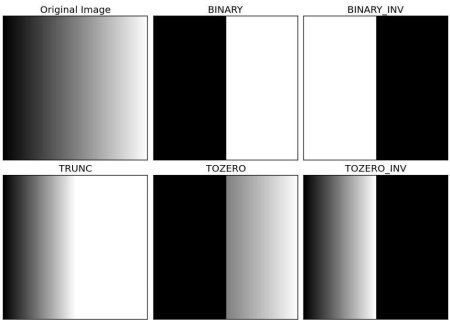
当像素值大于阀值时,我们给这个像素赋予一个新值(可能是白色),否则我们给予另外一种颜色(也许是黑色)。
cv2.threshold(img, thresh, maxval, type, dst=None)
- img: 原图像
- thresh: 阈值
- maxval: 当type指定为THRESH_BINARY或THRESH_BINARY_INV时,需要设置该值
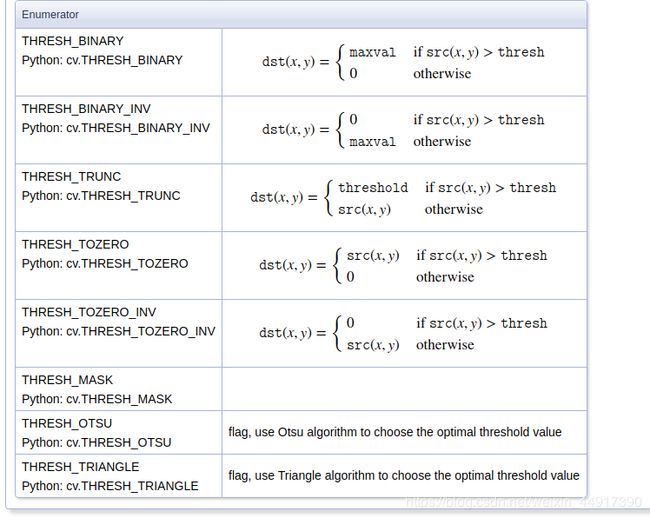
- type: 指定阈值类型;下面会列出具体类型:
- cv2.THRESH_BINARY
- cv2.THRESH_BINARY_INV
- cv2.THRESH_TRUNC
- cv2.THRESH_TOZERO
- cv2.THRESH_TOZERO_INV
这里的ret指的是自己输入的参数thresh: 阈值(下面程序)
import cv2
import numpy as np
import matplotlib.pyplot as plt

plt.rcParams['font.family'] = ['sans-serif']
plt.rcParams['font.sans-serif'] = ['SimHei']

img = cv2.imread('head.png',0)
img = cv2.cvtColor(img,cv2.COLOR_BGR2RGB)

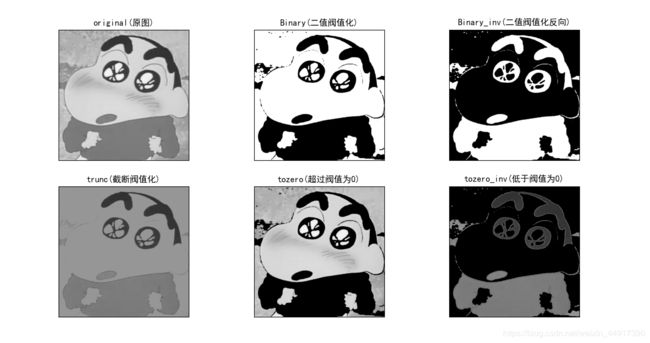
ret1, thresh1 = cv2.threshold(img, 150,255,cv2.THRESH_BINARY)
ret2, thresh2 = cv2.threshold(img, 150,255,cv2.THRESH_BINARY_INV)
ret3, thresh3 = cv2.threshold(img, 150,255,cv2.THRESH_TRUNC)
ret4, thresh4 = cv2.threshold(img, 150,255,cv2.THRESH_TOZERO)
ret5, thresh5 = cv2.threshold(img, 150,255,cv2.THRESH_TOZERO_INV)

title = ['original(原图)',
         'Binary(二值阀值化)',
         'Binary_inv(二值阀值化反向)',
         'trunc(截断阀值化)',
         'tozero(超过阀值为0)',
         'tozero_inv(低于阀值为0)']
images = [img,thresh1,thresh2,thresh3,thresh4,thresh5]

for i in range(6):
    plt.subplot(2,3,i+1),plt.imshow(images[i]),plt.title(title[i])
    plt.xticks([]),plt.yticks([])

plt.show()
从别人的博客那里偷了一个图,看起来舒服一点:
二、自适应阀值
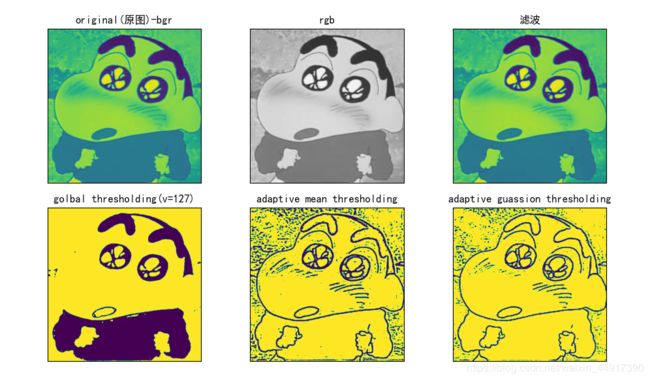
根据图像上的每一小区域计算与其对应的阀值。因此在同一副图像上的不同区域采用的是不同的阀值,从而使得我们能在不同的亮度的情况下得到更好的结果
cv2.adaptiveThreshold(img, maxval, thresh_type, type, Block Size, C)
- img: 输入图,只能输入单通道图像,通常来说为灰度图
- maxval: 当像素值超过了阈值(或者小于阈值,根据type来决定),所赋予的值
- thresh_type: 阈值的计算方法,包含以下2种类型:
- cv2.ADAPTIVE_THRESH_MEAN_C(阀值取自相邻区域的平均值)
- cv2.ADAPTIVE_THRESH_GAUSSIAN_C(阀值取自相邻区域的加权和,权重为一个高斯窗口)
- type:二值化操作的类型,与固定阈值函数相同,包含上面的五中类型
- Block Size: 领域大小(用来计算阀值的区域大小)
- C :阈值计算方法中的常数项(平均值或者是加权平均值减去这个常数)
import cv2
import numpy as np
import matplotlib.pyplot as plt

plt.rcParams['font.family'] = ['sans-serif']
plt.rcParams['font.sans-serif'] = ['SimHei']

img1 = cv2.imread('head.png',0)
img2 = cv2.cvtColor(img1,cv2.COLOR_BGR2RGB)
img4 = cv2.medianBlur(img1,5)

ret,thresh1 = cv2.threshold(img4, 127,255,cv2.THRESH_BINARY)

thresh2 = cv2.adaptiveThreshold(img4, 255, cv2.ADAPTIVE_THRESH_MEAN_C, cv2.THRESH_BINARY, 11, 2)
thresh3 = cv2.adaptiveThreshold(img4, 255, cv2.ADAPTIVE_THRESH_GAUSSIAN_C, cv2.THRESH_BINARY, 11, 2)

title = ['original(原图)-bgr','rgb','滤波','golbal thresholding(v=127)','adaptive mean thresholding','adaptive guassion thresholding']
images = [img1,img2,img4,thresh1,thresh2,thresh3]

for i in range(6):
    plt.subplot(2,3,i+1),plt.imshow(images[i]),plt.title(title[i])
    plt.xticks([]),plt.yticks([])

plt.show()- cv2.medianBlur(img, 5)
- 中值滤波,相当于将25个值进行排序,取中值作为当前值:参数说明:img表示当前的图片,3表示当前的方框尺寸
这里的用matplotlib来显示的话,颜色存在BGR和RGB的转换问题,是显示问题,但是看起来不是很舒服
但是如下所示,rgb已经转化成灰度图了,但是程序显示的维度却是三维的,这就很蒙蔽了(因为三维的图用不了阀值)
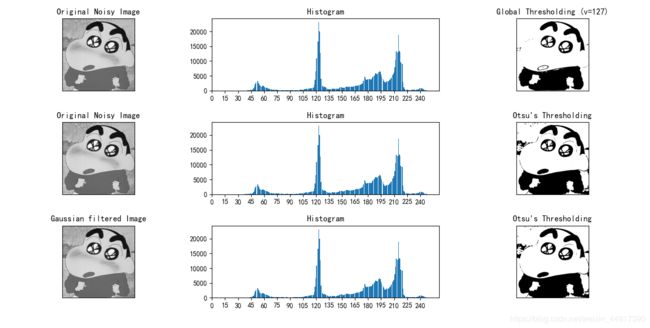
三、Otsu’s二值化
前面的阀值我们有选择的是150,也有127,那么实际情况,我们如何去选择这样的一个数字呢?
Otsu’s可以找到一个最好的阀值
注意plt.hist()直方图,是一维,则需要用ravel来将三维数据转化为一维
import cv2
import numpy as np
import matplotlib.pyplot as plt

plt.rcParams['font.family'] = ['sans-serif']
plt.rcParams['font.sans-serif'] = ['SimHei']

img = cv2.imread('head.png',0)

ret1,thresh1 = cv2.threshold(img, 127,255,cv2.THRESH_BINARY)
ret2,thresh2 = cv2.threshold(img, 0,255,cv2.THRESH_BINARY+cv2.THRESH_OTSU)
blur = cv2.GaussianBlur(img,(5,5),0)
ret3,thresh3 = cv2.threshold(blur, 127,255,cv2.THRESH_BINARY+cv2.THRESH_OTSU)


title = ['Original Noisy Image', 'Histogram', 'Global Thresholding (v=127)',
         'Original Noisy Image', 'Histogram', "Otsu's Thresholding",
         'Gaussian filtered Image', 'Histogram', "Otsu's Thresholding"]
images = [img, 0, thresh1,
          img, 0 ,thresh2,
          img, 0 ,thresh3]

for i in range(3):
    plt.subplot(3, 3, i * 3 + 1), plt.imshow(images[i * 3], 'gray')
    plt.title(title[i * 3]), plt.xticks([]), plt.yticks([])
    plt.subplot(3, 3, i * 3 + 2), plt.hist(images[i * 3].ravel(), 256)
    plt.title(title[i * 3 + 1]), plt.xticks([x for x in list(range(0,255,15))])
    plt.subplot(3, 3, i * 3 + 3), plt.imshow(images[i * 3 + 2], 'gray')
    plt.title(title[i * 3 + 2]), plt.xticks([]), plt.yticks([])

plt.show()
