geopandas 的使用以及相关问题
Geoff Boeing
Michelle Fullwood
%matplotlib  inline
import pandas as pd
import geopandas as gpd
from geopandas import GeoDataFrame, read_file
from geopandas.tools import sjoin
from shapely.geometry import Point, mapping,shape
import time
from geopandas.geoseries import Polygon
from geopandas import GeoSeries
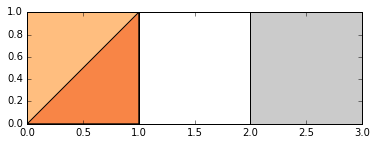
p1 = Polygon([(0, 0), (1, 0), (1, 1)])
p2 = Polygon([(0, 0), (1, 0), (1, 1), (0, 1)])
p3 = Polygon([(2, 0), (3, 0), (3, 1), (2, 1)])
g=GeoSeries([p1,p2,p3])
g
0         POLYGON ((0 0, 1 0, 1 1, 0 0))
1    POLYGON ((0 0, 1 0, 1 1, 0 1, 0 0))
2    POLYGON ((2 0, 3 0, 3 1, 2 1, 2 0))
dtype: object
g.plot()

g.area
0    0.5
1    1.0
2    1.0
dtype: float64
g.buffer(1).plot()

boros=GeoDataFrame.from_file(r'D:\下载\nybb_16a\nybb_16a\nybb.shp'.decode('utf-8'))
### IPython 带有中文的路径编码为uft-8,需更改编码为acci编码,win下才能识别。
r="D:\下载\nybb_16a\nybb_16a\nybb.shp"
import chardet
chardet.detect(r)
{‘confidence’: 0.7525, ‘encoding’: ‘utf-8’}
boros.set_index('BoroCode',inplace=True)
aa=boros.loc[5]['geometry']
boros.loc[5]
BoroName                                          Staten Island
Shape_Area                                          1.62382e+09
Shape_Leng                                               330470
geometry      (POLYGON ((970217.0223999023 145643.3322143555...
Name: 5, dtype: object
world=gpd.read_file(gpd.datasets.get_path('naturalearth_lowres'))
world.crs
{‘init’: u’epsg:4326’}
cities = gpd.read_file(gpd.datasets.get_path('naturalearth_cities'))
world.head()
|
continent |
gdp_md_est |
geometry |
iso_a3 |
name |
pop_est |
| 0 |
Asia |
22270.0 |
POLYGON ((61.21081709172574 35.65007233330923,… |
AFG |
Afghanistan |
28400000.0 |
| 1 |
Africa |
110300.0 |
(POLYGON ((16.32652835456705 -5.87747039146621… |
AGO |
Angola |
12799293.0 |
| 2 |
Europe |
21810.0 |
POLYGON ((20.59024743010491 41.85540416113361,… |
ALB |
Albania |
3639453.0 |
| 3 |
Asia |
184300.0 |
POLYGON ((51.57951867046327 24.24549713795111,… |
ARE |
United Arab Emirates |
4798491.0 |
| 4 |
South America |
573900.0 |
(POLYGON ((-65.50000000000003 -55.199999999999… |
ARG |
Argentina |
40913584.0 |
world = gpd.read_file(gpd.datasets.get_path('naturalearth_lowres'))
cities = gpd.read_file(gpd.datasets.get_path('naturalearth_cities'))
world.head()
|
continent |
gdp_md_est |
geometry |
iso_a3 |
name |
pop_est |
| 0 |
Asia |
22270.0 |
POLYGON ((61.21081709172574 35.65007233330923,… |
AFG |
Afghanistan |
28400000.0 |
| 1 |
Africa |
110300.0 |
(POLYGON ((16.32652835456705 -5.87747039146621… |
AGO |
Angola |
12799293.0 |
| 2 |
Europe |
21810.0 |
POLYGON ((20.59024743010491 41.85540416113361,… |
ALB |
Albania |
3639453.0 |
| 3 |
Asia |
184300.0 |
POLYGON ((51.57951867046327 24.24549713795111,… |
ARE |
United Arab Emirates |
4798491.0 |
| 4 |
South America |
573900.0 |
(POLYGON ((-65.50000000000003 -55.199999999999… |
ARG |
Argentina |
40913584.0 |
from geopandas import GeoDataFrame as df
from geopandas.geoseries import Point
df1 = df.set_geometry([Point(0,0), Point(1,1), Point(2,2)])
df2 = df.set_geometry('geom1')
-----------------------------------------------------------------------
修改默认的notebook的显示的图片大小
import matplotlib.pylab as pylab
import matplotlib.pyplot as plt
pylab.rcParams['figure.figsize'] = 20, 20
world.plot()

%matplotlib  inline
world.plot(color='white',figsize=(20, 20))
控制图像 需要认真的研究bokeh 一个Python 交互式的绘图包
import bokeh
from bokeh import mpl
from bokeh.plotting import output_file, show
citys=cities.to_crs(world.crs)
将交互式的画面显示在notebook 中,bokeh教程,实例
from ipywidgets import interact
import numpy as np

from bokeh.io import push_notebook, show, output_notebook
from bokeh.plotting import figure
output_notebook()

x = np.linspace(0, 2*np.pi, 2000)
y = np.sin(x)
p = figure(title="simple line example", plot_height=300, plot_width=600, y_range=(-5,5))
r = p.line(x, y, color="#2222aa", line_width=3)

def update(f, w=1, A=1, phi=0):
    if   f == "sin": func = np.sin
    elif f == "cos": func = np.cos
    elif f == "tan": func = np.tan
    r.data_source.data['y'] = A * func(w * x + phi)
    push_notebook()
show(p)


