Matlab实现:图像边缘提取
转: https://www.cnblogs.com/AndyJee/p/3737325.html
1、 边缘提取算法
方法一:一阶微分算子
-
Sobel算子
Sobel算子检测方法对灰度渐变和噪声较多的图像处理效果较好,Sobel算子对边缘定位不是很准确,图像的边缘不止一个像素。
-
Roberts算子
Roberts算子检测方法对具有陡峭的低噪声的图像处理效果较好,但是利用roberts算子提取边缘的结果是边缘比较粗,因此边缘的定位不是很准确。
-
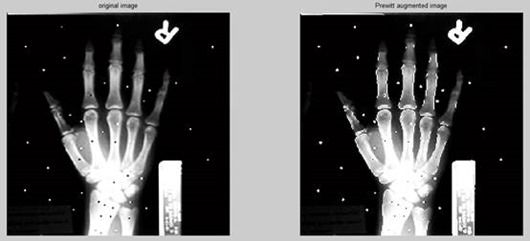
Prewitt算子
Prewitt算子检测方法对灰度渐变和噪声较多的图像处理效果较好。但边缘较宽,而且间断点多。
-
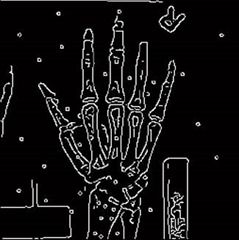
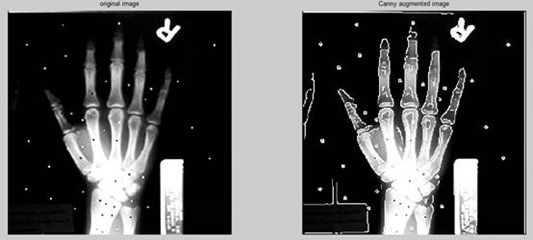
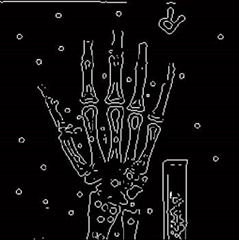
Canny算子
Canny算子是目前边缘检测最常用的算法,效果也是最理想的。
Canny边缘检测算法不是简单的模板卷积而已,通过梯度方向和双阈值法来检测边缘点,具体算法可以参考:http://www.cnblogs.com/AndyJee/p/3734805.html;
Canny方法不容易受噪声干扰,能够检测到真正的弱边缘。优点在于,使用两种不同的阈值分别检测强边缘和弱边缘,并且当弱边缘和强边缘相连时,才将弱边缘包含在输出图像中。
方法二:二阶微分算子
-
Laplacian算子
Laplacian算子法对噪声比较敏感,所以很少用该算子检测边缘,而是用来判断边缘像素视为与图像的明区还是暗区。
2、 实验结果分析
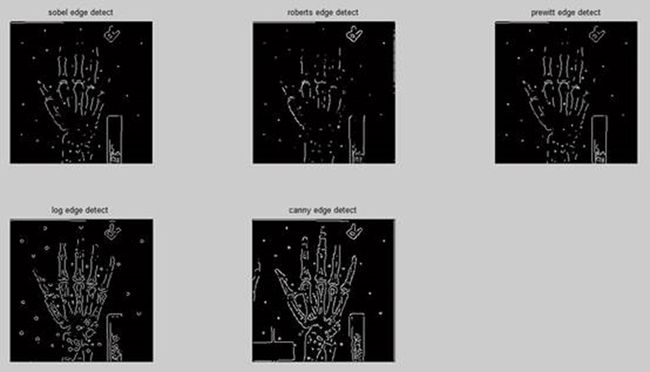
一、边缘提取:
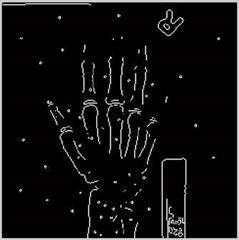
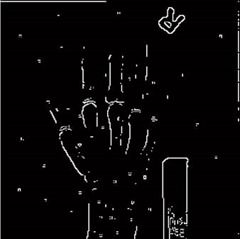
- Sobel算子检测方法对灰度渐变和噪声较多的图像处理效果较好,sobel算子对边缘定位不是很准确,图像的边缘不止一个像素;
- Roberts算子检测方法对具有陡峭的低噪声的图像处理效果较好,但是利用roberts算子提取边缘的结果是边缘比较粗,因此边缘的定位不是很准确;
- Prewitt算子检测方法对灰度渐变和噪声较多的图像处理效果较好。但边缘较宽,而且间断点多;
- Laplacian算子法对噪声比较敏感,所以很少用该算子检测边缘,而是用来判断边缘像素视为与图像的明区还是暗区;
- Canny方法不容易受噪声干扰,能够检测到真正的弱边缘。优点在于,使用两种不同的阈值分别检测强边缘和弱边缘,并且当弱边缘和强边缘相连时,才将弱边缘包含在输出图像中。
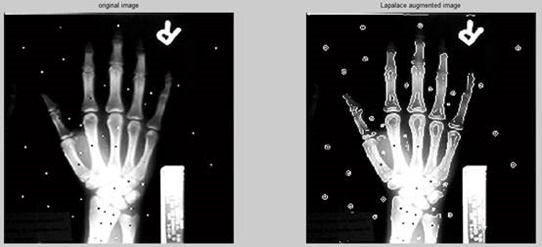
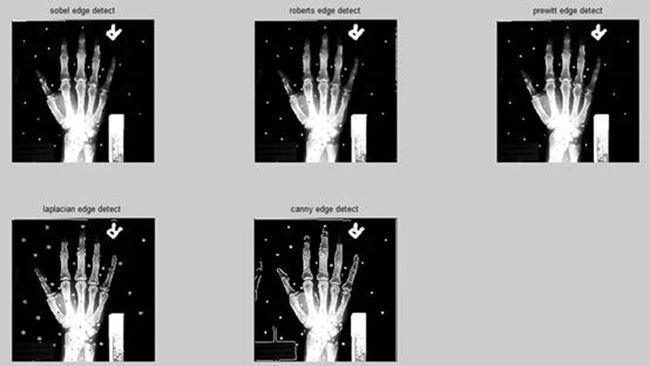
二、边缘复合增强
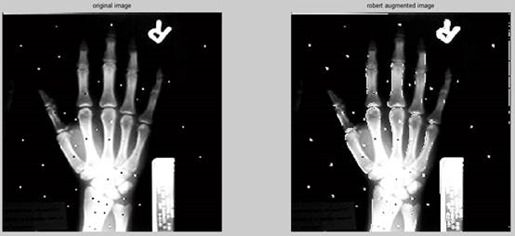
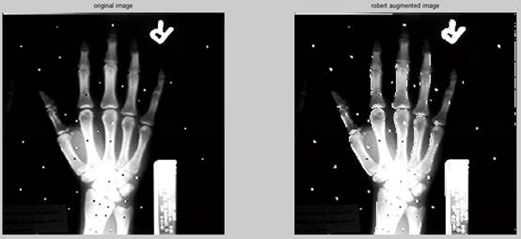
- Sobel、Robert、Prewitt算子的增强效果并不是很明显,尤其是Robert算子,因为它提取的边缘点过于稀疏和离散;
- Laplacian算子和canny算子的增强效果都比较理想, 将边缘叠加上去后,整个手的轮廓和边缘都很清晰,直观上看,canny算子实现的效果比Laplacian算子好,最明显的地方就是手指尖的边缘。
3、程序实现
下面的程序就实现上面效果的完整Matlab代码:
clear;clc;
I=imread('x1.tif');
% I=rgb2gray(I);
% gray transform

J=imadjust(I,[0.1 0.9],[0 1],1);

% Edge detection
% Sobel
BW1=edge(I,'sobel');
sobelBW1=im2uint8(BW1)+J;
figure;
%imshow(BW1);
subplot(1,2,1);
imshow(J);
title('original image');
subplot(1,2,2);
imshow(sobelBW1);
title('Sobel augmented image');
% Roberts
BW2=edge(I,'roberts');
robertBW2=im2uint8(BW2)+J;
figure;
%imshow(BW2);
subplot(1,2,1);
imshow(J);
title('original image');
subplot(1,2,2);
imshow(robertBW2);
title('robert augmented image');
% prewitt
BW3=edge(I,'prewitt');
prewittBW3=im2uint8(BW3)+J;
figure;
%imshow(BW3);
subplot(1,2,1);
imshow(J);
title('original image');
subplot(1,2,2);
imshow(prewittBW3);
title('Prewitt augmented image');
% log
BW4=edge(I,'log');
logBW4=im2uint8(BW4)+J;
figure;
%imshow(BW4);
subplot(1,2,1);
imshow(J);
title('original image');
subplot(1,2,2);
imshow(logBW4);
title('Laplacian augmented image');
% canny
BW5=edge(I,'canny');
cannyBW5=im2uint8(BW5)+J;
figure;
%imshow(BW5);
subplot(1,2,1);
imshow(J);
title('original image');
subplot(1,2,2);
imshow(cannyBW5);
title('Canny augmented image');
% gaussian & canny
% h=fspecial('gaussian',5);
% fI=imfilter(I,h,'replicate');
% BW6=edge(fI,'canny');
% figure;
% imshow(BW6);

figure;
subplot(2,3,1), imshow(BW1);
title('sobel edge detect');
subplot(2,3,2), imshow(BW2);
title('roberts edge detect');
subplot(2,3,3), imshow(BW3);
title('prewitt edge detect');
subplot(2,3,4), imshow(BW4);
title('log edge detect');
subplot(2,3,5), imshow(BW5);
title('canny edge detect');
% subplot(2,3,6), imshow(BW6);
% title('gasussian&canny edge detect');

figure;
subplot(2,3,1), imshow(sobelBW1);
title('sobel edge detect');
subplot(2,3,2), imshow(robertBW2);
title('roberts edge detect');
subplot(2,3,3), imshow(prewittBW3);
title('prewitt edge detect');
subplot(2,3,4), imshow(logBW4);
title('laplacian edge detect');
subplot(2,3,5), imshow(cannyBW5);
title('canny edge detect');
下面的Matlab程序是精简的边缘提取实现:
clear;clc;

I=imread('lena.bmp');
I=rgb2gray(I);
imshow(I,[]);
title('Original Image');

sobelBW=edge(I,'sobel');
figure;
imshow(sobelBW);
title('Sobel Edge');

robertsBW=edge(I,'roberts');
figure;
imshow(robertsBW);
title('Roberts Edge');

prewittBW=edge(I,'prewitt');
figure;
imshow(prewittBW);
title('Prewitt Edge');

logBW=edge(I,'log');
figure;
imshow(logBW);
title('Laplasian of Gaussian Edge');

cannyBW=edge(I,'canny');
figure;
imshow(cannyBW);
title('Canny Edge');

