QCustomPlot使用心得五:坐标轴常用属性设置
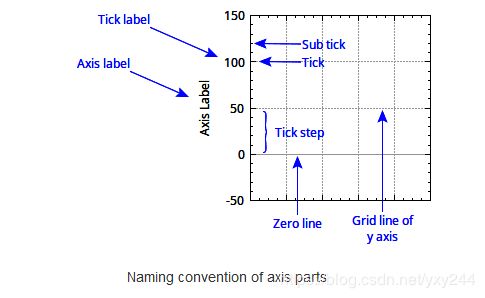
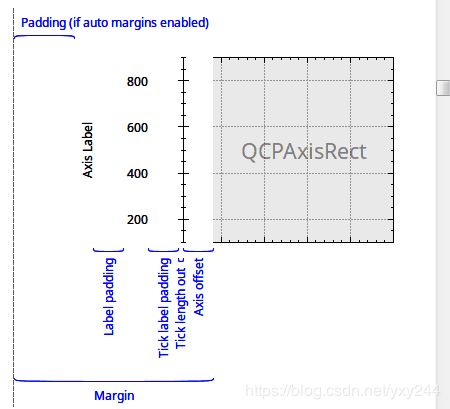
先看轴部分的名称约定,根据名称就可以修改对应的属性了
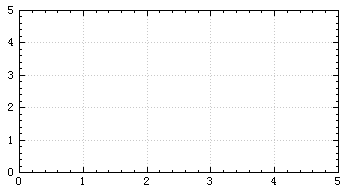
1.显示坐标轴
默认只显示左y轴和下边的x轴,调用setVisible(bool)设置轴是否显示
    customplot->yAxis2->setVisible(true);//显示y轴2
    customplot->xAxis2->setVisible(true);//显示x轴2
调用setupFullAxesBox,如果某一边没有轴会生成一个,并且四边的轴显示都设置true
customplot->axisRect()->setupFullAxesBox();//四边安装轴并显示2.轴线颜色
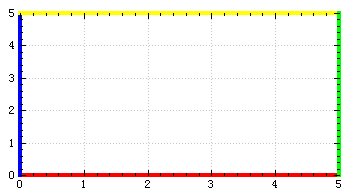
代码例子:
    customplot->xAxis->setBasePen(QPen(Qt::red,4));
    customplot->yAxis->setBasePen(QPen(Qt::blue,4));
    customplot->xAxis2->setBasePen(QPen(Qt::yellow,4));
    customplot->yAxis2->setBasePen(QPen(Qt::green,4));
3.网格线颜色
代码例子:
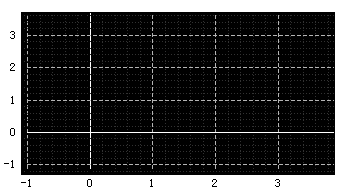
    customplot->axisRect()->setBackground(QBrush(Qt::black));//背景黑色
    customplot->xAxis->grid()->setPen(QPen(QColor(180, 180, 180), 1, Qt::PenStyle::DashLine));//网格白色虚线
    customplot->yAxis->grid()->setPen(QPen(QColor(180, 180, 180), 1, Qt::PenStyle::DashLine));//网格白色虚线
    customplot->xAxis->grid()->setSubGridPen(QPen(QColor(50, 50, 50), 1, Qt::DotLine));//网格浅色点线
    customplot->yAxis->grid()->setSubGridPen(QPen(QColor(50, 50, 50), 1, Qt::DotLine));//网格浅色点线
    customplot->xAxis->grid()->setSubGridVisible(true);//显示x轴子网格线
    customplot->yAxis->grid()->setSubGridVisible(true);//显示要轴子网格线
    customplot->xAxis->grid()->setZeroLinePen(QPen(Qt::white));//x轴0线颜色白色
    customplot->yAxis->grid()->setZeroLinePen(QPen(Qt::white));//y轴0线颜色白色
4.轴矩形背景使用图片
除了QBrush颜色填充背景,还可以设置图片作为背景
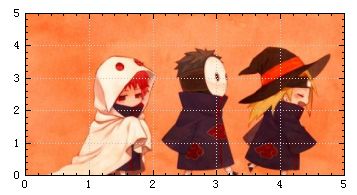
customplot->axisRect()->setBackgroundScaled(true);//启用背景缩放
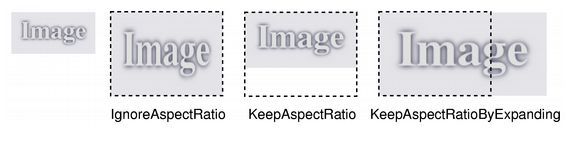
customplot->axisRect()->setBackgroundScaledMode(Qt::AspectRatioMode::IgnoreAspectRatio);//自由缩放
customplot->axisRect()->setBackground(QPixmap(":/image/background.jpg"));//背景图片这里有个缩放模式,默认自由缩放,还可以设置KeepAspectRatio或KeepAspectRatioByExpanding,效果如下。
5.刻度线长度和颜色
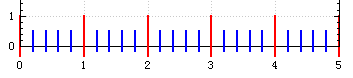
设置x轴刻度线长度和颜色,这里为了看清楚夸张一点,代码例子:
    QPen pen;
    pen.setColor(Qt::red);//主刻度红色
    pen.setWidth(2);//线宽2
    customplot->xAxis->setTickPen(pen);
    customplot->xAxis->setTickLengthIn(30);//主刻度向内延伸30
    customplot->xAxis->setTickLengthOut(10);//主刻度向外延伸10
    pen.setColor(Qt::blue);//子刻度蓝色
    customplot->xAxis->setSubTickPen(pen);
    customplot->xAxis->setSubTickLengthIn(15);//子刻度向内延伸15
    customplot->xAxis->setSubTickLengthOut(5);//子刻度向外延伸5
6.刻度值格式
设置前后对比:
![]()
![]()
  customPlot->xAxis->setNumberFormat("gbc");//g灵活的格式,b漂亮的指数形式,c乘号改成×
    customPlot->xAxis->setNumberPrecision(1);//精度1
setNumberFormat()的部分格式可以参考QString::number()
setNumberPrecision相当于设置 QString::number(double n, char format = 'g', int precision = 6)里的precision
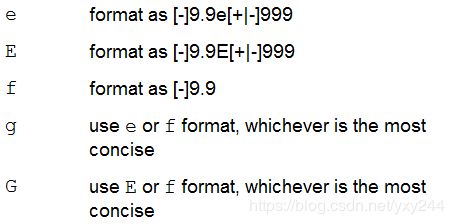
除此之外,还有两个特有的格式'b'和'c'
b:指数漂亮形式,默认科学计数![]() 会变成
会变成![]()
c:乘号变成×,![]() 会变成
会变成![]()
举例:
setNumberFormat("g") 数值小的时候用固定格式,数值大使用科学计数
setNumberFormat("gb") 数值小的时候用固定格式,数值大使用漂亮的10进制幂的指数形式
setNumberFormat("gbc") 在上面的基础上乘号显示×
setNumberFormat("fc") 非法格式,格式减少到'f'
setNumberFormat("hello") 非法格式,因为第一个字符不是'e', 'e', 'f', 'g'或'g'。当前格式代码将不会更改
6.改变刻度起始原点
![]()
有些需求要修改刻度显示的原点,例如原来是-10,-5,0,5,10,15,设置原点为1后变成-14,-9,-4,1,6,11,代码例子:
customplot->xAxis->setRange(-15,15);
customplot->xAxis->ticker()->setTickOrigin(1);//改变刻度原点为1
7.刻度数量
一般刻度数量是自动调整的,但也可以手动设置,例如-100到100默认5个主刻度
![]()
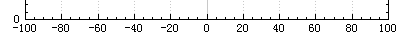
可以设置成11个主刻度,注意有个刻度步进策略,如果默认是tssReadability,那么customplot有时仍会自动调整,使刻度便于阅读,代码例子:
customplot->xAxis->ticker()->setTickCount(11);//11个主刻度
customplot->xAxis->ticker()->setTickStepStrategy(QCPAxisTicker::tssReadability);//可读性优于设置
8.刻度值显示和轴标签
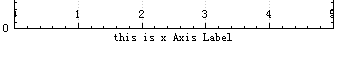
刻度值默认在外部,可以改成在内部,代码例子:
     customplot->xAxis->setTickLabels(true);//显示刻度值
     customplot->xAxis->setTickLabelSide(QCPAxis::LabelSide::lsInside);//显示在内部
     customplot->xAxis->setLabel("this is x Axis Label");//轴标签
9.线结尾装饰
坐标轴线结尾可以添加装饰,例如常用的箭头esSpikeArrow,下图QCPLineEnding枚举的图案
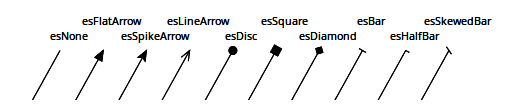
代码例子:
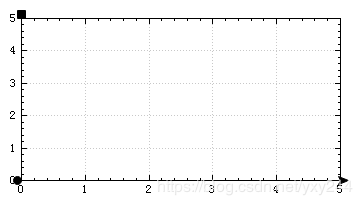
  customplot->xAxis->setUpperEnding(QCPLineEnding::esSpikeArrow);//x轴终点箭头图案
    customplot->xAxis->setLowerEnding(QCPLineEnding::esDisc);//x轴起点圆点图案
    customplot->yAxis->setUpperEnding(QCPLineEnding::esSquare);//y轴终点小方块图案
10.轴位置偏移量
设置离外部和内部各50,代码例子:
    customplot->xAxis->setPadding(50);//填充50的空间
    customplot->xAxis->setOffset(50);//偏移50