密度聚类(二)OPTICS和python实现
上一节写的DBSCAN算法的一个缺点是无法对密度不同的样本集进行很好的聚类,就如下图中所示,是DBSCAN获得的聚类结果,第二个图中紫色的点是异常点,由于黄色的样本集密度小,与另外2个样本集的区别很大,这个时候DBSCAN的缺点就显现出来了。

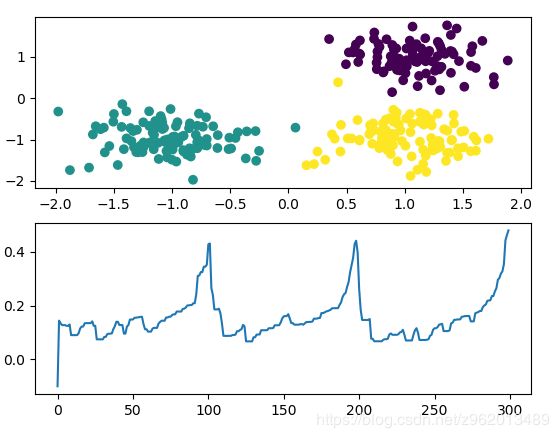
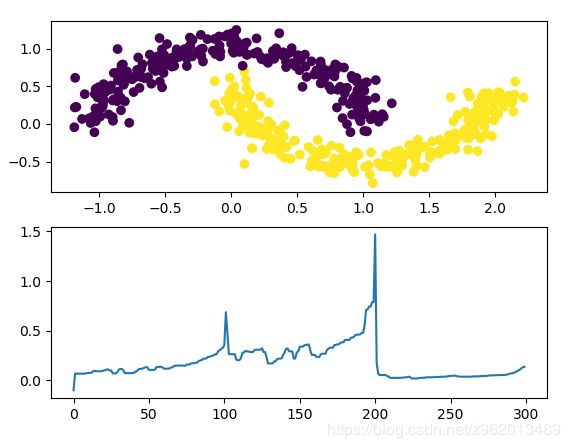
于是有人提出了另外一个算法叫做Ordering points to identify the clustering structure(OPTICS),这个算法有效的解决了密度不同导致的聚类效果不好的问题。OPTICS通过计算出一个可达距离列表来进行聚类,首先计算出所有的核心点,然后随机选择一个核心点,计算其附近点的可达距离并从小到大进行排序,如果附近的点存在核心点则递归式地继续计算附近核心点的周围点的可达距离并排序存在列表中,全部完成后画出可达距离列表,观察变化特别大的位置即为类别变化的地方,具体图片可参考博客最后的程序运行图。
OPTICS的参数和DBSCAN一样,也是 { ϵ , M i n P t s } \left \{ \epsilon ,MinPts \right \} {ϵ,MinPts}
引出核心距离定义:
对于核心点,距离其第 M i n P t s MinPts MinPts 近的点与之的距离

可达距离,对于核心点p,o到p的可达距离定义为o到p的距离和p的核心距离的最大值,即公式
![]()
在我实现的代码中,我将UNDEFINED定义为-1了,从原论文中也没发现确切的定义。
从wiki中扒出来一个OPTICS的伪代码:
 OPTICS(DB, eps, MinPts)
    for each point p of DB
       p.reachability-distance = UNDEFINED
    for each unprocessed point p of DB
       N = getNeighbors(p, eps)
       mark p as processed
       output p to the ordered list
       if (core-distance(p, eps, Minpts) != UNDEFINED)
          Seeds = empty priority queue
          update(N, p, Seeds, eps, Minpts)
          for each next q in Seeds
             N' = getNeighbors(q, eps)
             mark q as processed
             output q to the ordered list
             if (core-distance(q, eps, Minpts) != UNDEFINED)
                update(N', q, Seeds, eps, Minpts)
其中update()函数如下:
 update(N, p, Seeds, eps, Minpts)
    coredist = core-distance(p, eps, MinPts)
    for each o in N
       if (o is not processed)
          new-reach-dist = max(coredist, dist(p,o))
          if (o.reachability-distance == UNDEFINED) // o is not in Seeds
              o.reachability-distance = new-reach-dist
              Seeds.insert(o, new-reach-dist)
          else               // o in Seeds, check for improvement
              if (new-reach-dist < o.reachability-distance)
                 o.reachability-distance = new-reach-dist
                 Seeds.move-up(o, new-reach-dist)
下面给出python3.6实现代码:
# -*- coding: gbk -*-

import numpy as np
import matplotlib.pyplot as plt
import copy
from sklearn.datasets import make_moons
from sklearn.datasets.samples_generator import make_blobs
import random
import time


class OPTICS():
    def __init__(self, epsilon, MinPts):
        self.epsilon = epsilon
        self.MinPts = MinPts

    def dist(self, x1, x2):
        return np.linalg.norm(x1 - x2)

    def getCoreObjectSet(self, X):
        N = X.shape[0]
        Dist = np.eye(N) * 9999999
        CoreObjectIndex = []
        for i in range(N):
            for j in range(N):
                if i > j:
                    Dist[i][j] = self.dist(X[i], X[j])
        for i in range(N):
            for j in range(N):
                if i < j:
                    Dist[i][j] = Dist[j][i]
        for i in range(N):
            # 获取对象周围小于epsilon的点的个数
            dist = Dist[i]
            num = dist[dist < self.epsilon].shape[0]
            if num >= self.MinPts:
                CoreObjectIndex.append(i)
        return np.array(CoreObjectIndex), Dist

    def get_neighbers(self, p, Dist):
        N = []
        dist = Dist[p].reshape(-1)
        for i in range(dist.shape[0]):
            if dist[i] < self.epsilon:
                N.append(i)
        return N

    def get_core_dist(self, p, Dist):
        dist = Dist[p].reshape(-1)
        sort_dist = np.sort(dist)
        return sort_dist[self.MinPts - 1]

    def resort(self):
        '''
        根据self.ReachDist对self.Seeds重新升序排列
        '''
        reachdist = copy.deepcopy(self.ReachDist)
        reachdist = np.array(reachdist)
        reachdist = reachdist[self.Seeds]
        new_index = np.argsort(reachdist)
        Seeds = copy.deepcopy(self.Seeds)
        Seeds = np.array(Seeds)
        Seeds = Seeds[new_index]
        self.Seeds = Seeds.tolist()

    def update(self, N, p, Dist, D):

        for i in N:
            if i in D:
                new_reach_dist = max(self.get_core_dist(p, Dist), Dist[i][p])
                if i not in self.Seeds:
                    self.Seeds.append(i)
                    self.ReachDist[i] = new_reach_dist
                else:
                    if new_reach_dist < self.ReachDist[i]:
                        self.ReachDist[i] = new_reach_dist
                self.resort()

    def fit(self, X):

        length = X.shape[0]
        CoreObjectIndex, Dist = self.getCoreObjectSet(X)
        self.Seeds = []
        self.Ordered = []
        D = np.arange(length).tolist()
        self.ReachDist = [-0.1] * length

        while (len(D) != 0):
            p = random.randint(0, len(D) - 1)  # 随机选取一个对象
            p = D[p]
            self.Ordered.append(p)
            D.remove(p)

            if p in CoreObjectIndex:
                N = self.get_neighbers(p, Dist)
                self.update(N, p, Dist, D)

                while(len(self.Seeds) != 0):
                    q = self.Seeds.pop(0)
                    self.Ordered.append(q)
                    D.remove(q)
                    if q in CoreObjectIndex:
                        N = self.get_neighbers(q, Dist)
                        self.update(N, q, Dist, D)
        return self.Ordered, self.ReachDist

    def plt_show(self, X, Y, ReachDist, Ordered, name=0):
        if X.shape[1] == 2:
            fig = plt.figure(name)
            plt.subplot(211)
            plt.scatter(X[:, 0], X[:, 1], marker='o', c=Y)
            plt.subplot(212)
            ReachDist = np.array(ReachDist)
            plt.plot(range(len(Ordered)), ReachDist[Ordered])
        else:
            print('error arg')


if __name__ == '__main__':
    # 111111
    center = [[1, 1], [-1, -1], [1, -1]]
    cluster_std = 0.35
    X1, Y1 = make_blobs(n_samples=300, centers=center,
                        n_features=2, cluster_std=cluster_std, random_state=1)
    optics1 = OPTICS(epsilon=2, MinPts=5)
    Ordered, ReachDist = optics1.fit(X1)
    optics1.plt_show(X1, Y1, ReachDist, Ordered, name=1)
    # 2222222
    center = [[1, 1], [-1, -1], [2, -2]]
    cluster_std = [0.35, 0.1, 0.8]
    X2, Y2 = make_blobs(n_samples=300, centers=center,
                        n_features=2, cluster_std=cluster_std, random_state=1)
    optics2 = OPTICS(epsilon=2, MinPts=5)
    Ordered, ReachDist = optics2.fit(X2)
    optics2.plt_show(X2, Y2, ReachDist, Ordered, name=2)
    # 33333333
    X3, Y3 = make_moons(n_samples=500, noise=0.1)
    optics3 = OPTICS(epsilon=2, MinPts=5)
    Ordered, ReachDist = optics3.fit(X2)
    optics3.plt_show(X3, Y3, ReachDist, Ordered, name=3)
    plt.show()

上图为原数据和类别,下图为可达距离列表画出来的图,从图中可以看出3个趋势变化很类似的曲线,距离变化最剧烈的地方即为聚类结束的地方。

该图中3个样本集的密度差距很大,而OPTICS算法还是很好的进行了聚类,相比于DBSCAN要好很多

对于月牙形状的样本分布,OPTICS的表现不是很好,可能是因为2个样本在接触的地方密度相近。
OPTICS相比于DBSCAN而言,对参数的设置很不敏感,因为它是计算一个可达距离列表排序后查看变化最快的地方进行聚类的。
参考文献:
https://en.wikipedia.org/wiki/OPTICS_algorithm