echarts图表——条形图(柱状图)的动态横向显示设置
项目中要用到图表,简单地用echarts.js实现。
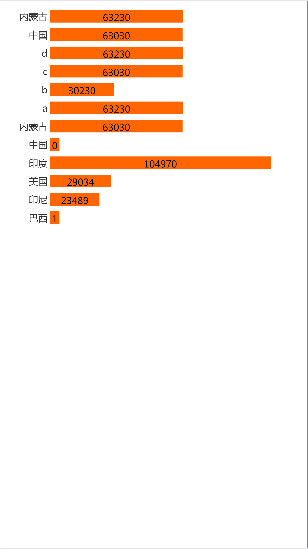
效果为:

是简单的无坐标轴显示的图表。
代码:
html:
<div id="main" style="width: 100%;">div>js(配置):
var length=12;//此处为动态数据的长度
var hei=(length*60)+'px';//动态获取图表高度
$("#main").css('height',hei);//动态设置图表高度
showchart();   //图表执行
//图表
function showchart(){//console.log(dbcnumb)
    var myChart = echarts.init(document.getElementById('main'));
    option = {
        title : {
            text: '',
            subtext: ''
        },
        tooltip : {
            trigger: 'item'  //悬浮提示框不显示
        },
        grid:{   //绘图区调整
            x:150,  //左留白
            y:10,   //上留白
            x2:10,  //右留白
            y2:10   //下留白
        },
        xAxis : [
            {
                show:false,
                type : 'value',
                boundaryGap : [0, 0],
                position: 'top'
            }
        ],
        yAxis : [
            {
                type : 'category',
                data : ['巴西','印尼','美国','印度','中国','内蒙古','a','b','c','d','中国','内蒙古'],
                axisLine:{show:false},     //坐标轴
                axisTick:[{    //坐标轴小标记
                    show:false
                }],
                axisLabel:{
                    textStyle:{
                        fontSize:'30'
                    }
                }
            }
        ],
        series : [
            {
                name:'',
                type:'bar',
                tooltip:{show:false},
                barMinHeight:30,  //最小柱高
                barWidth: 40,  //柱宽度
                barMaxWidth:100,   //最大柱宽度
                data:[1, 23489, 29034, 104970, 0, 63030,63230,30230,63030,63230,63030,63230],
                itemStyle:{
                    normal:{    //柱状图颜色
                        color:'#ff6600',
                        label:{
                            show: true,   //显示文本
                            position: 'inside',  //数据值位置
                            textStyle:{
                                color:'#000',
                                fontSize:'30'
                            }
                        }
                    }
                }
            }
        ]
    };
//          window.onresize = function () {  //适应页面
//              myChartContainer();
//              myChart.resize();
//          }
    myChart.setOption(option);
}
上面的图是项目中的页面,有用到css样式,而代码画出的图的最终效果有点差距,效果为:
要想实现字体的左对齐,要把数据值位置那行改为
position: 'insideLeft',即可。