本文主要参考博客:http://chengjunwang.com/en/2013/08/learn-basic-epidemic-models-with-python/。该博客有一些笔误,并且有些地方表述不准确,推荐大家阅读Albert-Laszlo Barabasi写得书Network Science,大家可以在如下网站直接阅读传染病模型这一章:http://barabasi.com/networksciencebook/chapter/10#contact-networks。Barabasi是一位复杂网络科学领域非常厉害的学者,大家也可以在他的官网上查看作者的一些相关工作。
下面我就直接把SIS模型和SIR模型的代码放上来一起学习一下。我的Python版本是3.6.1,使用的IDE是Anaconda3。Anaconda3这个IDE我个人推荐使用,用起来很方便,而且提供了Jupyther Notebook这个很好的交互工具,大家可以尝试一下,可在官网下载:https://www.continuum.io/downloads/。
在Barabasi写得书中,有两个Hypothesis:1,Compartmentalization; 2, Homogenous Mixing。具体看教材。
默认条件:1, closed population; 2, no births; 3, no deaths; 4, no migrations.
1. SI model
 1 # -*- coding: utf-8 -*-
 2
 3 import scipy.integrate as spi
 4 import numpy as np
 5 import pylab as pl
 6
 7 beta=1.4247
 8 """the likelihood that the disease will be transmitted from an infected to a susceptible
 9 individual in a unit time is β"""
10 gamma=0
11 #gamma is the recovery rate and in SI model, gamma equals zero
12 I0=1e-6
13 #I0 is the initial fraction of infected individuals
14 ND=70
15 #ND is the total time step
16 TS=1.0
17 INPUT = (1.0-I0, I0)
18
19 def diff_eqs(INP,t):
20     '''The main set of equations'''
21     Y=np.zeros((2))
22     V = INP
23     Y[0] = - beta * V[0] * V[1] + gamma * V[1]
24     Y[1] = beta * V[0] * V[1] - gamma * V[1]
25     return Y   # For odeint
26
27 t_start = 0.0; t_end = ND; t_inc = TS
28 t_range = np.arange(t_start, t_end+t_inc, t_inc)
29 RES = spi.odeint(diff_eqs,INPUT,t_range)
30 """RES is the result of fraction of susceptibles and infectious individuals at each time step respectively"""
31 print(RES)
32
33 #Ploting
34 pl.plot(RES[:,0], '-bs', label='Susceptibles')
35 pl.plot(RES[:,1], '-ro', label='Infectious')
36 pl.legend(loc=0)
37 pl.title('SI epidemic without births or deaths')
38 pl.xlabel('Time')
39 pl.ylabel('Susceptibles and Infectious')
40 pl.savefig('2.5-SI-high.png', dpi=900) # This does increase the resolution.
41 pl.show()
结果如下图所示
在早期,受感染个体的比例呈指数增长, 最终这个封闭群体中的每个人都会被感染,大概在t=16时,群体中所有个体都被感染了。
2. SIS model
 1 # -*- coding: utf-8 -*-
 2
 3 import scipy.integrate as spi
 4 import numpy as np
 5 import pylab as pl
 6
 7 beta=1.4247
 8 gamma=0.14286
 9 I0=1e-6
10 ND=70
11 TS=1.0
12 INPUT = (1.0-I0, I0)
13
14 def diff_eqs(INP,t):
15     '''The main set of equations'''
16     Y=np.zeros((2))
17     V = INP
18     Y[0] = - beta * V[0] * V[1] + gamma * V[1]
19     Y[1] = beta * V[0] * V[1] - gamma * V[1]
20     return Y   # For odeint
21
22 t_start = 0.0; t_end = ND; t_inc = TS
23 t_range = np.arange(t_start, t_end+t_inc, t_inc)
24 RES = spi.odeint(diff_eqs,INPUT,t_range)
25
26 print(RES)
27
28 #Ploting
29 pl.plot(RES[:,0], '-bs', label='Susceptibles')
30 pl.plot(RES[:,1], '-ro', label='Infectious')
31 pl.legend(loc=0)
32 pl.title('SIS epidemic without births or deaths')
33 pl.xlabel('Time')
34 pl.ylabel('Susceptibles and Infectious')
35 pl.savefig('2.5-SIS-high.png', dpi=900) # This does increase the resolution.
36 pl.show()
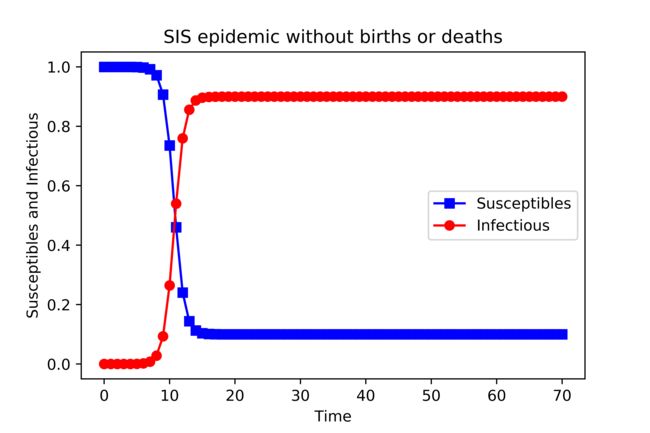
运行之后得到结果如下图:
由于个体被感染后可以恢复,所以在一个大的时间步,上图是t=17,系统达到一个稳态,其中感染个体的比例是恒定的。因此,在稳定状态下,只有有限部分的个体被感染,此时并不意味着感染消失了,而是此时在任意一个时间点,被感染的个体数量和恢复的个体数量达到一个动态平衡,双方比例保持不变。请注意,对于较大的恢复率gamma,感染个体的数量呈指数下降,最终疾病消失,即此时康复的速度高于感染的速度,故根据恢复率gamma的大小,最终可能有两种可能的结果。
3. SIR model
# -*- coding: utf-8 -*-

import scipy.integrate as spi
import numpy as np
import pylab as pl

beta=1.4247
gamma=0.14286
TS=1.0
ND=70.0
S0=1-1e-6
I0=1e-6
INPUT = (S0, I0, 0.0)

def diff_eqs(INP,t):
	'''The main set of equations'''
	Y=np.zeros((3))
	V = INP
	Y[0] = - beta * V[0] * V[1]
	Y[1] = beta * V[0] * V[1] - gamma * V[1]
	Y[2] = gamma * V[1]
	return Y   # For odeint

t_start = 0.0; t_end = ND; t_inc = TS
t_range = np.arange(t_start, t_end+t_inc, t_inc)
RES = spi.odeint(diff_eqs,INPUT,t_range)

print(RES)

#Ploting
pl.plot(RES[:,0], '-bs', label='Susceptibles')  # I change -g to g--  # RES[:,0], '-g',
pl.plot(RES[:,2], '-g^', label='Recovereds')  # RES[:,2], '-k',
pl.plot(RES[:,1], '-ro', label='Infectious')
pl.legend(loc=0)
pl.title('SIR epidemic without births or deaths')
pl.xlabel('Time')
pl.ylabel('Susceptibles, Recovereds, and Infectious')
pl.savefig('2.1-SIR-high.png', dpi=900) # This does, too
pl.show()
所得结果如下图:


