D3 二维图表的绘制系列(三十)平行坐标系折线图
上一篇: 径向树图
下一篇: 热力地图
代码结构和初始化画布的Chart对象介绍,请先看 这里
本图完整的源码地址: 这里
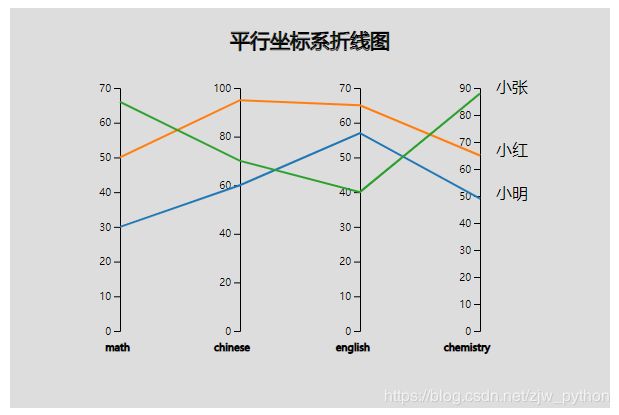
1 图表效果
2 数据
name,math,chinese,english,chemistry
小明,30,60,57,49
小红,50,95,65,65
小张,66,70,40,88
3 关键代码
导入数据
d3.csv('./data.csv', function(d){
    return {
        name: d.name,
        math: +d.math,
        chinese: +d.chinese,
        english: +d.english,
        chemistry: +d.chemistry
    };
}).then(function(data){
....
一些样式参数配置
const config = {
        lineColor: chart._colors(0),
        margins: {top: 80, left: 50, bottom: 50, right: 50},
        textColor: 'black',
        title: '平行坐标系折线图',
        hoverColor: 'red',
        padding: 120,
        animateDuration: 1000
    }
平行坐标系需要对每一个维度都生成一个度量尺度
/* ----------------------------尺度转换------------------------  */
    const fields =  ['math', 'chinese', 'english', 'chemistry'];
    chart.scales = d3.zip(...(data.map((item) => d3.permute(item, fields)))).map((subject) => {
        return d3.scaleLinear()
                    .domain([0, Math.floor(d3.max(subject)/10 + 1)*10])
                    .range([chart.getBodyHeight()*0.9, 0]);
    });
渲染坐标轴,注意各轴的横向偏移距离
 /* ----------------------------渲染坐标轴------------------------  */
    chart.renderAxis = function(){
        chart.scales.forEach((scale, index) => {
            chart.body()
                 .append('g')
                 .attr('class', 'axis axis-' + index)
                 .attr('transform', 'translate(' + (index+0.5) * config.padding + ',0)' )
                 .call(d3.axisLeft(scale).ticks(7));
        });
    }
渲染连线,运用d3.line快速画线
/* ----------------------------渲染线条------------------------  */
    chart.renderLines = function(){
        const lines = chart.body().append('g')
                                .attr('class', 'lines')
                                .selectAll('.line')
                                .data(data);

        const linesEnter = lines.enter()
                                .append('g')
                                .attr('class', 'line');

              linesEnter.append('path')
                            .attr('stroke', (d,i) => chart._colors(i % 10))
                            .attr('stroke-width', 2)
                            .attr('fill', 'none')
                            .attr('d', (d) => d3.line()(generatePoints(d)))

              linesEnter.append('text')
                            .attr('dx', '1em')
                            .attr('transform', (d,i) => 'translate(' + 3.5 * config.padding + ',' + chart.scales[chart.scales.length-1](d['chemistry'])+')' )
                            .text((d) => d.name)

              lines.exit()
                      .remove()

        function generatePoints(d) {
            return d3.permute(d, ['math', 'chinese', 'english', 'chemistry']).map((item, index) => {
                return [
                    (index+0.5) * config.padding,
                    chart.scales[index](item)
                ];
            });
        }

    }
大功告成!!!
![]()
