在vue项目中实现echarts中自动轮播聚焦显示提示框tooltip
导读
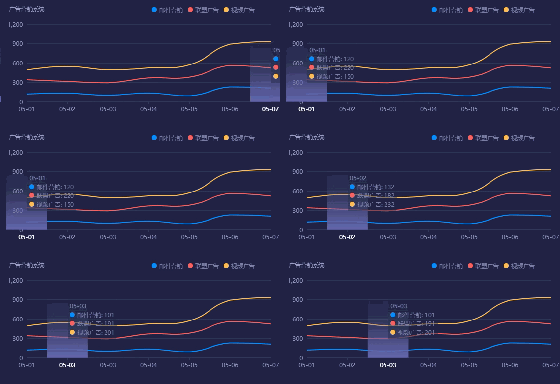
最新需要实现一个需求,echarts折线图,不需要鼠标触控,也能自动轮播聚焦,显示tooltip数据框,我们来看下最终的案例效果演示:

附上案例源码
initCharts(){
   let option = {
        title: {
            show: false
        },
        tooltip: {
            trigger: 'axis',
            backgroundColor: "rgba(35, 47, 76, 0.5)",
            position: function (point, params, dom, rect, size) {
                  // 固定在中部
                  return [point[0], '40%'];
            },
            textStyle:{
                color:'rgba(124, 129, 173, 0.98)',
                fontSize: 12
            },
            axisPointer: {
                type: "shadow",
                label: {
                    show: true,
                    backgroundColor: 'transparent'
                },
                shadowStyle:{
                    color:{
                        type: 'linear', x: 0, y: 0, x2: 0, y2: 1,
                        colorStops: [{
                            offset: 0, color: 'rgba(100, 101, 171, 0)' // 0% 处的颜色
                        }, {
                            offset: 0.5, color: 'rgba(100, 101, 171, 0.2)' // 50% 处的颜色
                        },{
                            offset: 0.999999, color: 'rgba(100, 101, 171, 1)' // 100% 处的颜色
                        },{
                            offset: 1, color: 'rgba(100, 101, 171, 1)' // 100% 处的颜色
                        }],
                        global: false // 缺省为 false
                    }
                }
            }
        },
        legend: {
            show: true, // 9194c4
            textStyle: {
                color: "rgba(145, 148, 196, 0.8)"
            },
            icon: 'circle',
            itemWidth: 10,
            itemHeight: 10,
            borderWidth: 0,
            top:20,
            right: 50,
            data:['邮件营销','联盟广告','视频广告']
        },
        grid: {
            left: '3%',
            right: '4%',
            bottom: '3%',
            containLabel: true
        },
        xAxis: {
            type: 'category',
            boundaryGap: false,
            axisLine: {
                lineStyle: {
                    color: '#2e3a59'
                }
            },
            axisLabel: {
                show: true,
                textStyle: {
                    color: "#9195c4"
                }
            },
            data: ['05-01','05-02','05-03','05-04','05-05','05-06','05-07']
        },
        yAxis: {
            type: 'value',
            name:"广告营销系统", //监控处置系统
            position: "left",
            nameTextStyle: {
                color: "#979bcb",
                fontSize: 12,
                padding: [0, 0, 10, 0]
            },
            splitNumber:3,
            axisLabel: {
                show: true,
                textStyle: {
                    color: "#9195c4"
                }
            },
            axisLine: {
                lineStyle: {
                    color: 'transparent'
                }
            },
            splitLine:{
                lineStyle:{
                    color:"#2c3859"
                }
            }
        },
        series: [
            {
                name:'邮件营销',
                smooth: true, //平滑曲线显示
                itemStyle: {
                    //折线拐点标志的样式
                    color: "#058cff",
                    opacity: 0
                },
                type:'line',
                stack: '总量',
                data:[120, 132, 101, 134, 90, 230, 210]
            },
            {
                name:'联盟广告',
                smooth: true, //平滑曲线显示
                itemStyle: {
                    //折线拐点标志的样式
                    color: "#f86161",
                    opacity: 0
                },
                type:'line',
                stack: '总量',
                data:[220, 182, 191, 234, 290, 330, 310]
            },
            {
                name:'视频广告',
                smooth: true, //平滑曲线显示
                itemStyle: {
                    //折线拐点标志的样式
                    color: "#ffbb53",
                    opacity: 0
                },
                type:'line',
                stack: '总量',
                data:[ 150, 232, 201, 154, 190, 330, 410 ]
            }
        ]
    };

    echarts.dispose(document.getElementById('box-center-one__charts'))
    let myChart = echarts.init(document.getElementById('box-center-one__charts'))
    myChart.setOption(option)

    // 动态显示tootip
    var faultByHourIndex = 0; //播放所在下标
    var faultByHourTime = setInterval(function() { //使得tootip每隔三秒自动显示
        myChart.dispatchAction({
            type: 'showTip', // 根据 tooltip 的配置项显示提示框。
            seriesIndex: 0,
            dataIndex: faultByHourIndex
        });
        faultByHourIndex++;
        // faultRateOption.series[0].data.length 是已报名纵坐标数据的长度
        if (faultByHourIndex >= option.series[0].data.length) {
            faultByHourIndex = 0;
        }
        if (faultByHourIndex >= option.series[1].data.length) {
            faultByHourIndex = 0;
        }
        if (faultByHourIndex >= option.series[2].data.length) {
            faultByHourIndex = 0;
        }
    }, 3000 );

}
},
核心: dispatchAction
文档地址:https://echarts.baidu.com/api.html#echartsInstance.dispatchAction
