利用nls进行非线性模型中的参数估计
nls参数估计
利用nls进行非线性模型中的参数估计
R中的nls用于非线性回归建模,对非线性函数的参数进行最优化的过程,最优化后的参数会使得模型的RSS(残差平方和)达到最小。
1、非线性函数
本例中的函数(如下):因变量为K,自变量为theta_w,常数值Ks,n,未知参数为ts,theta_c。 现在实测值K,以及其对应的theta_w已知,利用R中的nls对未知参数参数进行估计。
f  <- function(theta_w,Ks,n,ts,theta_c){
  Ksat <- Ks^(1-n)*0.6^n
  Kdry <- 0.75*10^(-1.2*n)
  b1<- ((-theta_c*Ksat^(1/ts))+((n- theta_c)*Kdry^(1/ts))) / (2*(n-theta_c))
  b2<- (Ksat^(1/ts)-Kdry^(1/ts))/ (2*(n-theta_c))
  b3<- ((theta_c*Ksat^(1/ts)-(n-theta_c)*Kdry^(1/ts))^2+(4*theta_c*(n-theta_c)*Ksat^(1/ts)*Kdry^(1/ts)))/((Ksat^(1/ts)-Kdry^(1/ts))^2)
  sgn<- ifelse (ts>0,1,-1)
  b<-(b3+2*theta_w*b1*b2^(-1)+theta_w^2)
  (b1+b2*theta_w+sgn*b2*sqrt(b))^ts
}
2、样本数据
| Ks | N | Vw | K | |
|---|---|---|---|---|
| 959 | 3 | 0.4 | 0.08 | 0.70 |
| 960 | 3 | 0.4 | 0.16 | 0.92 |
| 961 | 3 | 0.4 | 0.24 | 1.14 |
| 962 | 3 | 0.4 | 0.32 | 1.32 |
| 963 | 3 | 0.4 | 0.40 | 1.47 |
3、拟合
# nls函数
Kmodel <- nls(K~f(Vw,Ks,N,ts,theta_c),
              data=b,
              start = list(ts=0.3,theta_c=0.01),
              trace = T,
              algorithm = "plinear")
# 生成新的数据,检验拟合效果
# 自变量Vw
linedata <- data.frame(Vw=seq(range(b$Vw)[1],range(b$Vw)[2],length.out = 1000))
# 模型预测的因变量p.precict
linedata$p.predict <- predict(Kmodel,newdata = linedata)4、画图
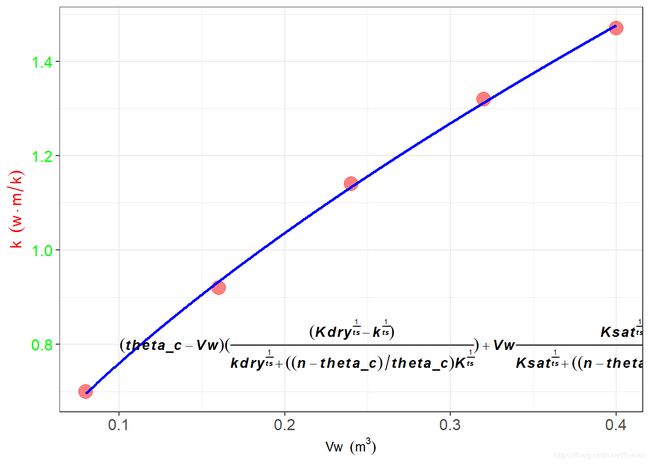
require(ggplot2)ggplot()+
geom_point(aes(x=Vw,y=K),data=b,alpha=0.5,size=5,colour="red")+ # 实测值
geom_line(aes(x=Vw,y=p.predict),data = linedata,size=1,colour="blue")+ # 预测值
scale_x_continuous(name =expression(Vw ~~ (m^3)))+ # x轴的标签
scale_y_continuous(name=expression(k~~(w%.%m/k)),seq(0,1.6,by=0.2))+ # y 轴的标签
geom_text(aes(x=0.3,y=0.8),
label="bolditalic((theta_c-Vw)*(frac((Kdry^frac(1,ts)-k^frac(1,ts)),kdry^frac(1,ts)+((n-theta_c)/theta_c)*K^frac(1,ts)))+Vw*frac(Ksat^frac(1,ts)-K^frac(1,ts),Ksat^frac(1,ts)+((n-theta_c)/theta_c)*K^frac(1,ts))==0)",
parse=TRUE)+ # 向图中加入一个文本,内容是一个公式(因此parse参数为TRUE),bolditalic粗斜体,
theme_bw()+ # 图的主题,对投影显示友好
theme(axis.title.x=element_text(size=10),
axis.text.x=element_text(size=12),
axis.title.y = element_text(size=12,colour="red"),
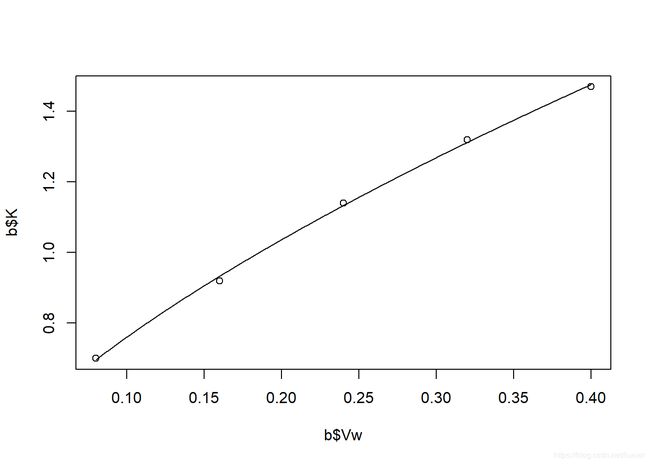
axis.text.y = element_text(size=12,colour = "green"))# 另外一种简单的画图
plot(b$Vw,b$K) # 实测值
linedata <- data.frame(Vw=seq(min(b$Vw),max(b$Vw),len=1000)) # 预测值
lines(linedata$Vw,predict(Kmodel,newdata = linedata)) # 添加一条线5、估计结果
summary(Kmodel)##
## Formula: K ~ f(Vw, Ks, N, ts, theta_c)
##
## Parameters:
## Estimate Std. Error t value Pr(>|t|)
## ts 0.610397 0.086504 7.056 0.0195 *
## theta_c -0.035790 0.029790 -1.201 0.3526
## .lin 0.936682 0.007385 126.839 6.22e-05 ***
## ---
## Signif. codes: 0 '***' 0.001 '**' 0.01 '*' 0.05 '.' 0.1 ' ' 1
##
## Residual standard error: 0.01285 on 2 degrees of freedom
##
## Number of iterations to convergence: 5
## Achieved convergence tolerance: 2.354e-06# 残差平方和
print(sum(resid(Kmodel)^2))## [1] 0.000330233# 置信区间
print(confint(Kmodel))## 0.005508579 : -0.03579032 0.91154803
## 0.0007335358 : -0.001539893 0.933172830
## 0.0006405405 : -0.005221184 0.930686382
## 0.0006405255 : -0.005269082 0.930654289
## 0.001780982 : 0.01874066 0.92466250
## 0.001750437 : 0.01699051 0.92333840
## 0.003510878 : 0.03235898 0.91736114
## 0.003485021 : 0.03099086 0.91623093
## 0.003485018 : 0.03100731 0.91624447
## 0.003485018 : 0.03100697 0.91624419
## 0.005708777 : 0.04151602 0.91028148
## 0.005691975 : 0.04055723 0.90943022
## 0.005691963 : 0.04058379 0.90945373
## 0.005691963 : 0.04058285 0.90945290
## 0.004145567 : -0.03579032 0.95797439
## 0.000488848 : -0.06558523 0.94169307
## 0.0004736416 : -0.06778575 0.94054926
## 0.0004736413 : -0.06779563 0.94054414
## 0.0007949981 : -0.1048301 0.9439478
## 0.0007925363 : -0.1058801 0.9434683
## 0.0007925363 : -0.1058789 0.9434689
## 0.00126062 : -0.1612774 0.9465161
## 0.001258849 : -0.1623630 0.9460951
## 0.001258849 : -0.1623576 0.9460972
## 0.001805321 : -0.2495881 0.9486805
## 0.001804003 : -0.2507815 0.9483061
## 0.001804003 : -0.2507707 0.9483094
## 0.002350912 : -0.4055288 0.9503632
## 0.002350077 : -0.4068318 0.9500577
## 0.002350077 : -0.4068147 0.9500617
## 0.002800351 : -0.7367893 0.9515020
## 0.002799936 : -0.7382284 0.9512828
## 0.002799936 : -0.7382046 0.9512864
## 0.003067024 : -1.7042623 0.9520675
## 0.00306689 : -1.7059428 0.9519412
## 0.00306689 : -1.7059114 0.9519436
## 0.004034679 : 0.6103973 0.9189819
## 0.0004787692 : 0.6960000 0.9388282
## 0.0004702413 : 0.7007112 0.9398449
## 0.000470241 : 0.7006868 0.9398396
## 0.0007814139 : 0.8064250 0.9426631
## 0.0007809892 : 0.8051963 0.9424348
## 0.0007809891 : 0.8052127 0.9424379
## 0.001239653 : 0.9593244 0.9451871
## 0.001239347 : 0.9580737 0.9449935
## 0.001239347 : 0.9580936 0.9449966
## 0.00177962 : 1.1955778 0.9475396
## 0.00177934 : 1.194077 0.947355
## 0.00177934 : 1.1941034 0.9473582
## 0.002325756 : 1.6072614 0.9495906
## 0.002325457 : 1.6051638 0.9494006
## 0.002325457 : 1.6052031 0.9494041
## 0.002781801 : 2.468225 0.951158
## 0.002781443 : 2.4646820 0.9509506
## 0.002781443 : 2.4647515 0.9509547
## 0.003058806 : 4.9247652 0.9520488
## 0.00305845 : 4.9176975 0.9518426
## 0.00305845 : 4.9178400 0.9518468
## 0.005667276 : 0.6103973 0.9565813
## 0.0006959862 : 0.5107624 0.9298622
## 0.0006567159 : 0.5179825 0.9319869
## 0.000656695 : 0.5181515 0.9320363
## 0.000656695 : 0.5181542 0.9320371
## 0.001919193 : 0.4474104 0.9276066
## 0.001911399 : 0.4446455 0.9266770
## 0.001911384 : 0.4445239 0.9266360
## 0.001911384 : 0.4445182 0.9266340
## 0.003976496 : 0.3974863 0.9226638
## 0.003967371 : 0.3948751 0.9216910
## 0.003967305 : 0.3946534 0.9216081
## 0.003967304 : 0.3946339 0.9216008
## 0.003967304 : 0.3946322 0.9216001
## 0.006644467 : 0.3609845 0.9179346
## 0.006636685 : 0.3588294 0.9170686
## 0.006636541 : 0.3585383 0.9169513
## 0.006636538 : 0.3584981 0.9169351
## 0.006636538 : 0.3584926 0.9169328
## 2.5% 97.5%
## ts 0.4445379 1.33478713
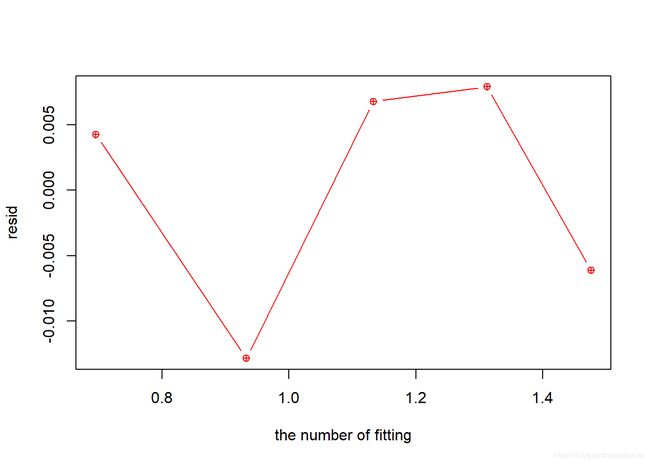
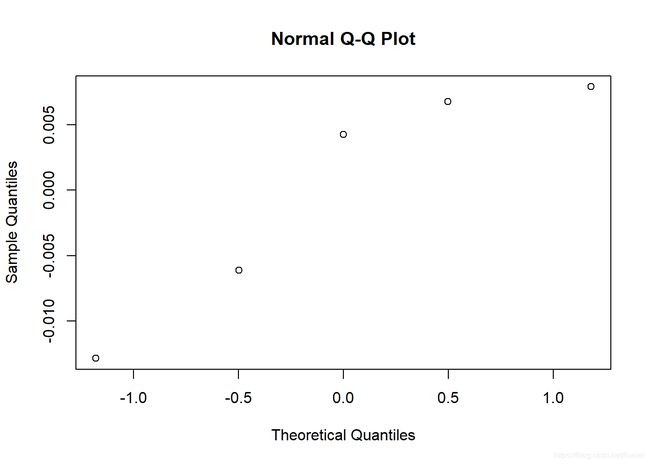
## theta_c -0.2976832 0.01616755plot(fitted(Kmodel),resid(Kmodel),pch=10,type="b",col="red",xlab = "the number of fitting", ylab="resid")# qq图
qqnorm(residuals(Kmodel))error: 不同的数据在拟合过程中出现了三种错误:
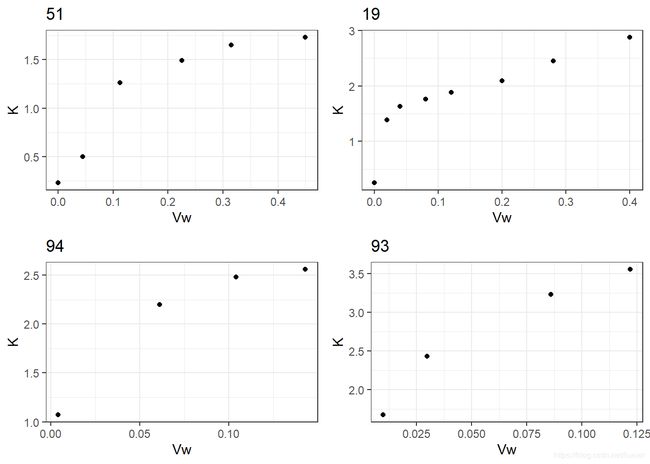
51 Error in numericDeriv(form[[3L]], names(ind), env) : Missing value or an infinity produced when evaluating the model(why?)
19 Error in nls(bK f(bK f(bVw, bKs,bKs,bN, ts, theta_c), data = b, start = list(ts = 0.3, : step factor 0.000488281 reduced below ‘minFactor’ of 0.000976562(why?)
94/93 Error in model.frame.default(formula = ~b + K + Vw + Ks + N, data = b) : invalid type (list) for variable ‘b’(原因:数据记录小于等于4)
