kaggle练习-共享单车数据
中国小黄车的惨败,激起了我对共享单车的兴趣。国外的这一行业要早于中国,这个数据是来自kaggle的比赛项目,由美国一家共享单车公司提供。(ps:这个项目当做练习已经做了好久了,今天才整理出来,感觉自己有点拖延症上身了哦)
数据基本结构
1、载入数据
import numpy as np
import pandas as pd
import matplotlib.pyplot as plt
import seaborn as sns
from datetime import datetime
import matplotlib
matplotlib.matplotlib_fname()
train=pd.read_csv('train.csv')
test=pd.read_csv('test.csv')
通过shape我们看到:共有10886个训练样本和6493个测试样本,训练集样本特征为12列。
2、特征说明
datetime:时间。年月日小时格式
season:季节。1:春天;2:夏天;3:秋天;4:冬天
holiday:是否节假日。0:否;1:是
workingday:是否工作日。0:否;1:是
weather:天气。1:晴天;2:阴天;3:小鱼或小雪;4:恶劣天气
temp:实际温度
atemp:体感温度
humidity:湿度
windspeed:风速
casual:未注册用户租车数量
registered:注册用户租车数量
count:总租车数量
3、查看数据缺失情况
用命令train.info()和test.info(),未发现有数据缺失的情况。
4、检查数据异常值
用命令train.describe()来观察数据的描述性统计的信息,如下:
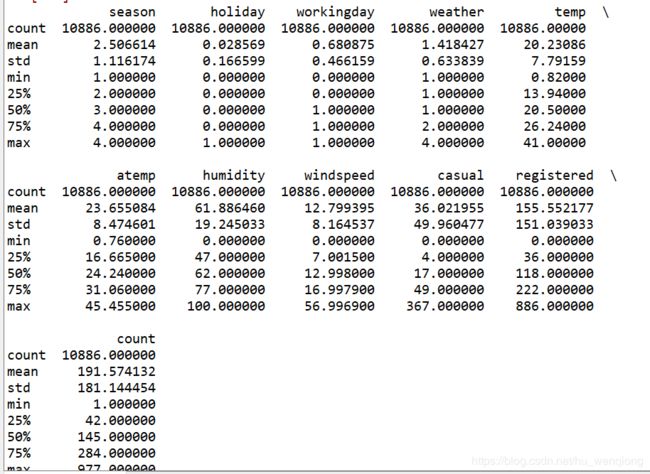
从图中我们可以发现,我们最终需要预测的租赁量(count)标准差很大,来看一下它的分布情况:
plt.rcParams['font.sans-serif']=['SimHei']
plt.rcParams['axes.unicode_minus'] = False
plt.figure(figsize=(10,10))
plt.hist(train['count'],bins=20)
plt.title('租赁量分布趋势')
plt.xlabel('租赁量(count)')
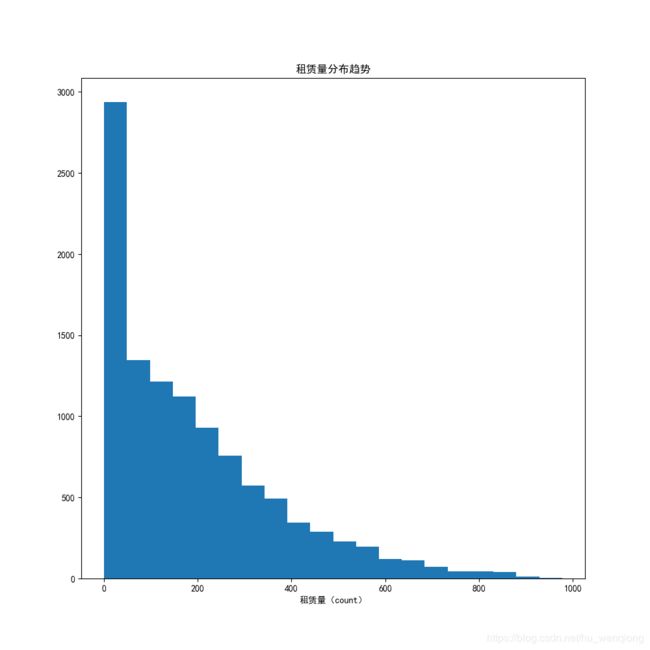
整体的分布倾斜比较严重,需要处理一下,以便于最后不会过拟合。
根据3 σ \sigma σ原则,我们将3个标准差以外的数据排除以后,然后对count做log变换,并查看变换后的分布。
train=train[np.abs(train['count']-train['count'].mean())<=3*train['count'].std()]
fig=plt.figure()
plt.subplot(1,1,1)
sns.distplot(train['count'])
plt.title('移除异常点后的租赁量分布')
plt.xlabel('租赁量(count)')
plt.savefig('1_after.png')
#对数变换
y=train['count'].values
y_log=np.log(y)
sns.distplot(y_log)
plt.title('log变换后的count分布')
plt.savefig('log.png')
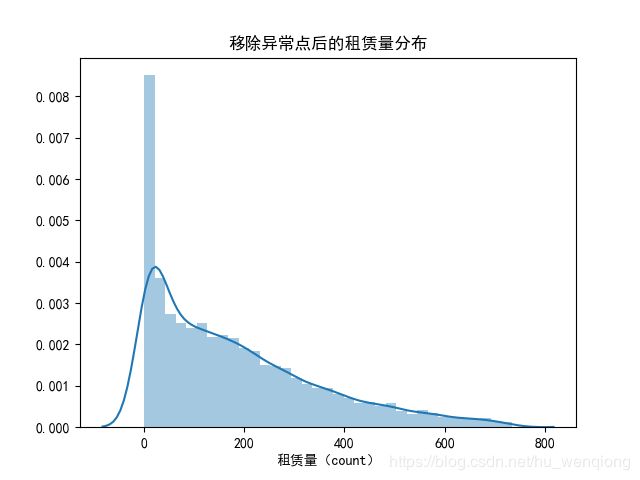
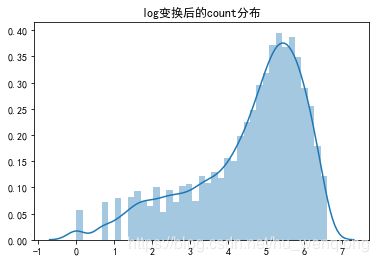
我们看到:转换过后,图形的分布倾斜没有那么严重了,差异也变小了。
为了方便清洗数据,我们将训练集和测试集合并。combined=pd.concat([train,test],ignore_index=True)
5、与时间有关的变量处理
我们将时间进行拆分,划分到年、月、日、星期、时段。
combined['date']=combined.datetime.apply(lambda x:x.split()[0])
combined['hour']=combined.datetime.apply(lambda x:x.split()[1].split(':')[0]).astype('int')
combined['year']=combined.datetime.apply(lambda x:x.split()[0].split('-')[0]).astype('int')
combined['month']=combined.datetime.apply(lambda x:x.split()[0].split('-')[1]).astype('int')
combined['weekday']=combined.date.apply( lambda x : datetime.strptime(x,'%Y-%m-%d').isoweekday())
6、观察一些重要的特征
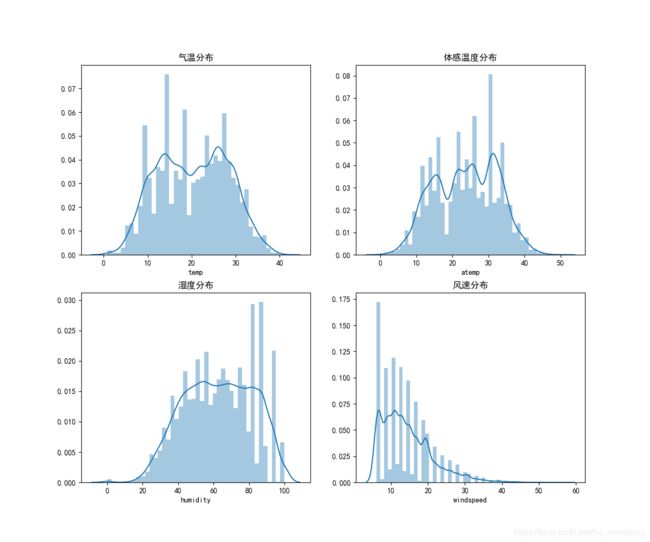
在这里,我们先来观察一下温度(temp)、体感温度(atemp)、湿度(humidity)、风速(windspeed)这几个特征的分布。
fig,axes=plt.subplots(2,2)
fig.set_size_inches(12,10)
sns.distplot(combined['temp'],ax=axes[0,0])
sns.distplot(combined['atemp'],ax=axes[0,1])
sns.distplot(combined['humidity'],ax=axes[1,0])
sns.distplot(combined['windspeed'],ax=axes[1,1])
axes[0,0].set(xlabel='temp',title='气温分布')
axes[0,1].set(xlabel='atemp',title='体感温度分布')
axes[1,0].set(xlabel='humidity',title='湿度分布')
axes[1,1].set(xlabel='windspeed',title='风速分布')
plt.savefig('分布分析.png')
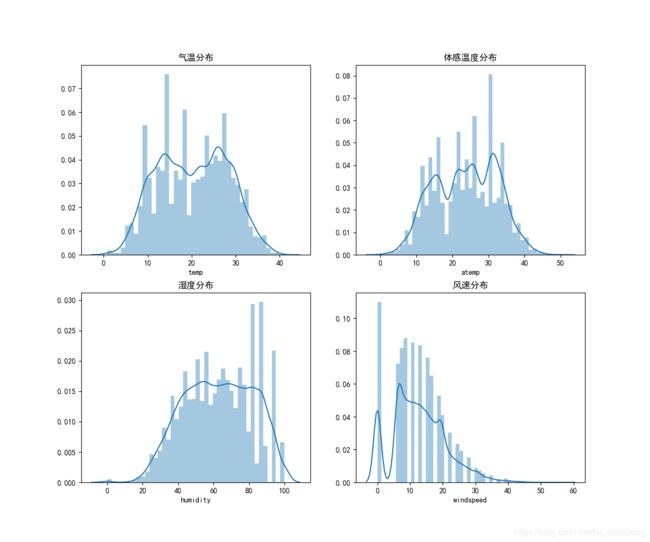
通过这些分布图可以发现:风速为0的数据很多,而在风速1-6之间出现了一些空白,我们推测:有些风速数据是缺失了的,但是数据中将缺失的风速都填充为0了。这些填充为0的数据可能会影响我们的预测。所以我们把这些数据当做缺失数据来进行填充,选用的方法是选取某些特征使用随机森林预测。
7、缺失数据(风速)的填充
相同的年月、季节、温度、湿度等特征都会影响风速,所以我们选择这些特征来进行预测
#用随机森林预测风速
speed_null=combined[combined['windspeed']==0]
speed_notnull=combined[combined['windspeed']!=0]
#选择特征
windspeed_trainX=speed_notnull[['season','weather','humidity','month','temp','year','atemp']]
windspeed_trainY=speed_notnull['windspeed']
windspeed_testX=speed_null[['season','weather','humidity','month','temp','year','atemp']]
from sklearn.ensemble import RandomForestRegressor
from sklearn.grid_search import GridSearchCV
rf=RandomForestRegressor(random_state=10)

param1={'n_estimators':list(range(100,500,50))}
model1=GridSearchCV(estimator = rf,param_grid = param1, scoring='mean_squared_error',cv=5)
model1.fit(windspeed_trainX,windspeed_trainY)
model1.best_score_
model1.best_params_
param2={'max_depth':list(range(3,10,1)),'min_samples_split':list(range(10,20,2))}
model2=GridSearchCV(estimator = RandomForestRegressor(random_state=10,n_estimators=450),param_grid = param2, scoring='mean_squared_error',cv=5)
model2.fit(windspeed_trainX,windspeed_trainY)
model2.best_score_
model2.best_params_

speed_model=RandomForestRegressor(n_estimators=450,random_state=10,max_depth=9,min_samples_split=10)
speed_model.fit(windspeed_trainX,windspeed_trainY)
windspeed_testY=speed_model.predict(windspeed_testX)
combined.loc[combined.windspeed==0,'windspeed']=windspeed_testY
以上的代码运用了交叉验证的方法对随机森林进行调参,分别从bagging框架和树的内部进行调差,选出最优的参数,然后建立模型进行预测。
再来看填充后的数据特征分布:
fig,axes=plt.subplots(2,2)
fig.set_size_inches(12,10)
sns.distplot(combined['temp'],ax=axes[0,0])
sns.distplot(combined['atemp'],ax=axes[0,1])
sns.distplot(combined['humidity'],ax=axes[1,0])
sns.distplot(combined['windspeed'],ax=axes[1,1])
axes[0,0].set(xlabel='temp',title='气温分布')
axes[0,1].set(xlabel='atemp',title='体感温度分布')
axes[1,0].set(xlabel='humidity',title='湿度分布')
axes[1,1].set(xlabel='windspeed',title='风速分布')
plt.savefig('分布分析2.png')
数据可视化
从时间特征分析
1、一天各个时间断的租赁量
我们将数据集按照hour这个属性分组,然后求每一组的平均值。
group_hour=combined.groupby(combined.hour)
hour_mean=group_hour[['count','registered','casual']].mean()
fig=plt.figure(figsize=(10,10))
plt.plot(hour_mean['count'],label='count')
plt.plot(hour_mean['registered'],label='registered')
plt.plot(hour_mean['casual'],label='casual')

plt.title('一天中不同时间的租赁量')
plt.legend(loc=2)
plt.savefig('时间趋势_day.png')
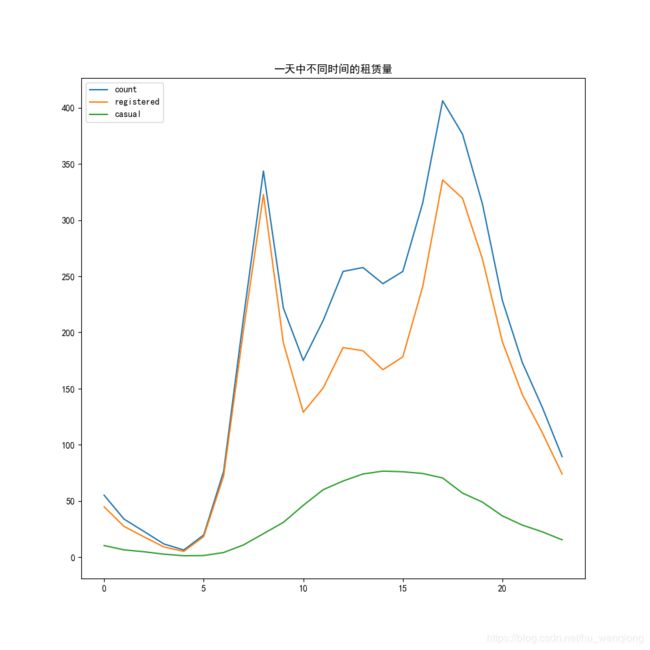
从上面的图形可以看到:图形中有两个峰,一个是早上7-8点,另一个是下午5-6点,分别是早高峰和晚高峰,符合实际情况。下面我们再将工作日和非工作日分开看看一天中时段的区别。
#区分工作日和非工作日
workingday_df=combined[combined['workingday']==1]
group_working=workingday_df.groupby('hour')
hour1_mean=group_working[['count','registered','casual']].mean()
noworkingday_df=combined[combined['workingday']==0]
group_noworking=noworkingday_df.groupby('hour')
hour2_mean=group_noworking[['count','registered','casual']].mean()

plt.figure(figsize=(15,8))
plt.subplot(1,2,1)
plt.plot(hour1_mean['count'],label='count')
plt.plot(hour1_mean['registered'],label='registered')
plt.plot(hour1_mean['casual'],label='casual')
plt.title('工作日一天中不同时间的租赁量')
plt.legend(loc=2)
plt.subplot(1,2,2)
plt.plot(hour2_mean['count'],label='count')
plt.plot(hour2_mean['registered'],label='registered')
plt.plot(hour2_mean['casual'],label='casual')
plt.title('非工作日一天中不同时间的租赁量')
plt.legend(loc=2)
plt.savefig('区分工作日时间趋势.png')
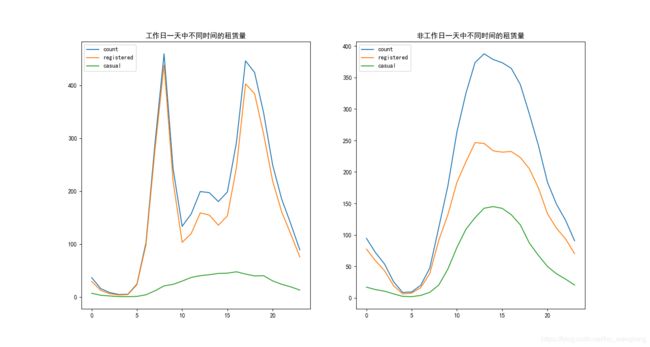
通过工作日和非工作日的趋势对比,我们发现:工作日的时候上下班高峰期表现明显,而在非工作日的时候大家都比较喜欢下午2-3点之后出门。这和我们中国人的习惯是一样的。
2、不同年月租赁量区别
#每日总和
group_yw=combined.groupby(['date','weekday'])
yearweek=group_yw[['count','registered','casual']].sum()
#按月取平均值
group_month=combined.groupby(['year','month'],as_index=False)
month_mean=group_month[['count','registered','casual']].mean()
month_mean['weekday']=group_month['weekday'].min()['weekday']
month_mean.rename(columns={'weekday':'day'},inplace=True)
month_mean['date']=pd.to_datetime(month_mean[['year','month','day']])
X=month_mean['date']
plt.figure(figsize=(18,6))
plt.subplot(1,1,1)
plt.plot(X,month_mean['count'],marker=0,linewidth=1.3,label='总租赁量')
plt.plot(X,month_mean['registered'],marker=1,linewidth=1.3,label='注册用户')
plt.plot(X,month_mean['casual'],marker=2,linewidth=1.3,label='临时用户')
plt.title('每月的日均租赁量变化')
plt.legend()
plt.savefig('每月的日租赁量.png')
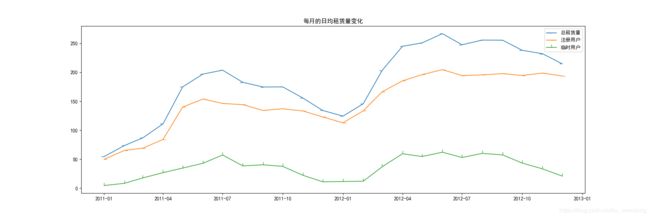
从一年的趋势来看,每年的春夏秋季节是租赁量比较高的年份,尤其是6月份的时候;而且每一年的趋势大致相同;但是综合两年来看,两年的租赁量在逐步上升。
3、季节对租赁量的影响
按照季节统计每日的平均租赁量,并分开年份来看:
#季节对租赁量的影响
day_df=combined.groupby('date').agg({'year':'mean','season':'mean',
                                      'casual':'sum', 'registered':'sum',
                                      'count':'sum','temp':'mean',
                                      'atemp':'mean','workingday':'mean',
                                      'weekday':'mean','holiday':'mean',})
season_day_mean=day_df.groupby(['year','season'],as_index=True).agg({'casual':'mean', 'registered':'mean','count':'mean'})
temp_df = day_df.groupby(['year','season'], as_index=True).agg({'temp':'mean', 'atemp':'mean'})
season_day_mean.plot(figsize=(15,9),xticks=range(0,9))
plt.title('不同季节日均租赁量')
plt.savefig('不同季节日均.png')
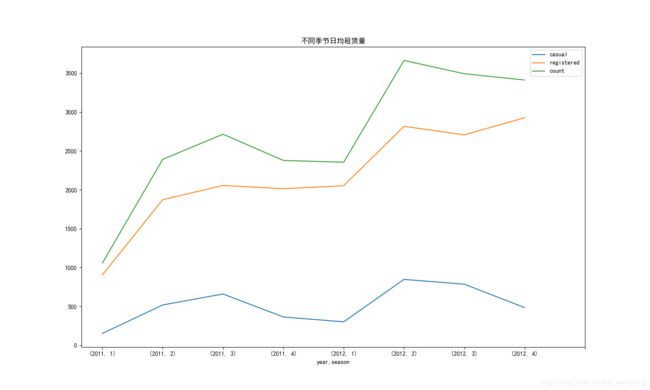
通过季节和月份的趋势图:我们发现,临时用户和注册用户用车数量变化趋势大体一致,且两年间都在秋季左右达到了比较高的用车辆,说明人们都比较喜欢在这段时间外出游玩。
4是否工作日对租赁量影响
working_df_mean=combined.groupby(['workingday'],as_index=True).agg({'count':'mean','registered':'mean','casual':'mean'})
workingday_df_mean1= working_df_mean.loc[0]
workingday_df_mean2 = working_df_mean.loc[1]
working_df_mean.plot.bar(stacked=True,title='平均每日租赁量(工作日VS非工作日)')
plt.xticks([0,1],('非工作日','工作日'),rotation=30)
plt.savefig('工作日和非工作日.png')

plt.figure(figsize=(15,8))
plt.subplot(1,2,1)
plt.pie(workingday_df_mean1, labels=['count','registered','casual',], autopct='%1.1f%%')
plt.title('非工作日')
plt.subplot(1,2,2)
plt.pie(workingday_df_mean2, labels=['count','registered','casual',], autopct='%1.1f%%')
plt.title('工作日')
plt.savefig('工作vs非工作饼.png')
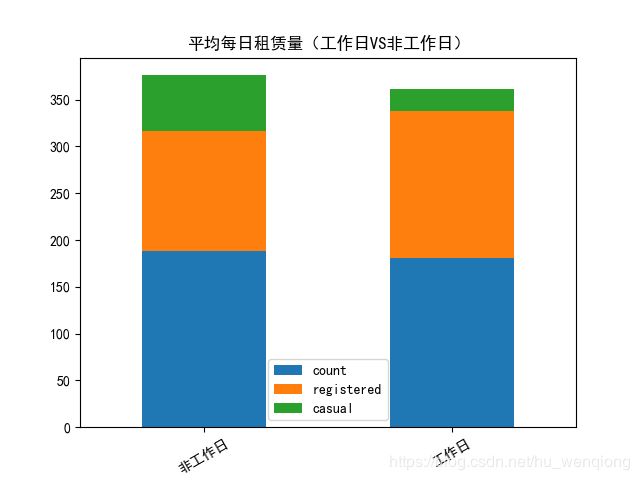
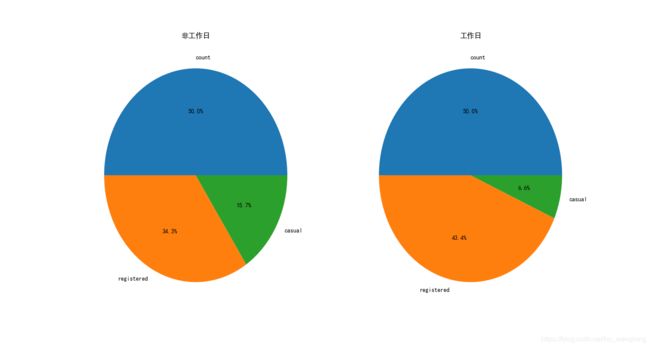
通过对比非工作日和工作日的饼图,我们发现:在非工作日的时候非注册用户使用共享单车的占比要比工作日的时候要多。这也符合实际情况:非工作日的时候有更多的人(不经常使用共享单车)出来玩。
5、一周内不同的时间对租赁量的影响
#按照星期几统计
weekday_mean=combined.groupby(['weekday'],as_index=True).agg({'casual':'mean','registered':'mean'})
weekday_mean.plot.bar(stacked=True,title='一周内各天平均租赁量')
plt.savefig('一周中的日租赁量.png')
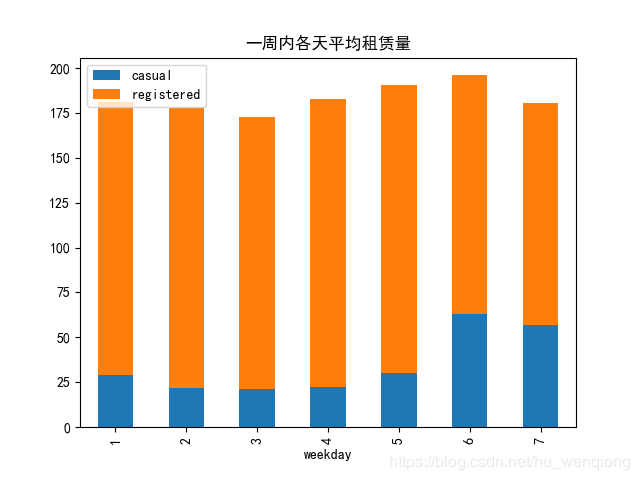
一周之内,星期六的租赁量最高,可以推断这是人们最有时间也最喜欢出去玩的一天,而且非注册用户的数量也是最高的。
6、节假日对租赁量的影响
holiday_group1 =combined.groupby(['date'],as_index=True).agg({'holiday':'mean','year':'mean'})
holiday_count=holiday_group1.groupby(['year']).agg({'holiday':'sum'})
holiday_mean=combined.groupby(['holiday'],as_index=True).agg({'casual':'mean','registered':'mean'})
holiday_mean.plot.bar(stacked=True,title='节假日与非节假日的日均租赁量')
plt.savefig('节假日vs非节假日.png')
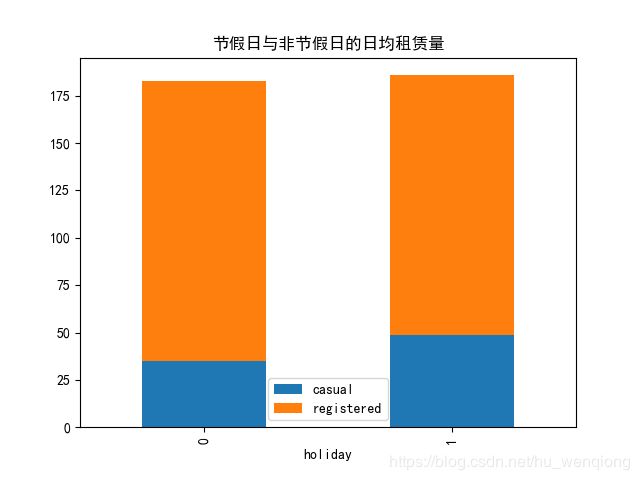
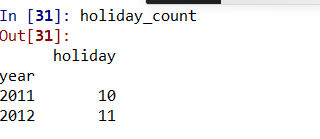
通过运行结果我们看到节假日和非节假日的总体租赁量差别并不大,这是因为在一年中节假日也就一周左右,占比非常少,所以结果也是可以理解。
天气因素对租赁量 的影响
1、天气情况影响
首先我们要看一下总体天气情况的四类天气汇总
weather_group=combined.groupby(['weather'])
weather_count=weather_group[['count','registered','casual']].count()
weather_mean=weather_group[['count','registered','casual']].mean()
weather_mean.plot.bar(stacked=True,title='不同天气每小时平均租赁量')
plt.savefig('不同天气.png')

天气晴朗的天气占大多数,像天气4这种恶劣的天气记录只有1条,所以我们对每类按小时取平均值。
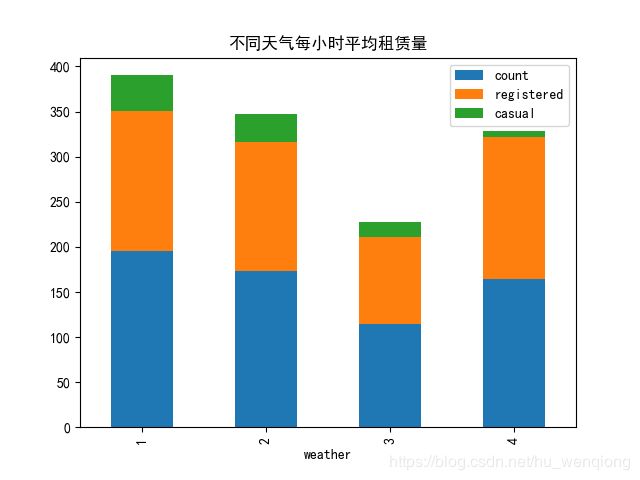
出乎意料的是:在天气4这么糟糕的情况下,平均每小时租赁量竟然这么高,是为什么呢?把这条数据找出来看看。
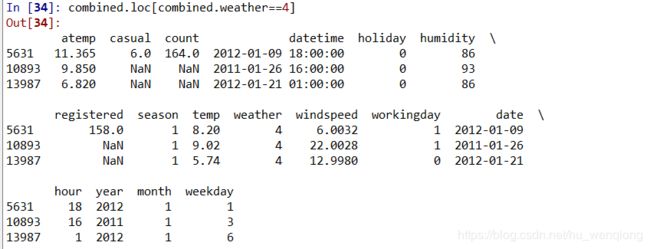
从结果显示可以看出:后两条都是测试集数据,忽略;第一条数据的时间是下午6点,刚好是下班的高峰期,所以能够理解为什么这条数据对应的租赁量均值那么高了(均值就是这一条数据的值)。
2、气温对于租赁量的影响
#气温
temp_df=combined.groupby(['temp']).agg({'count':'mean','registered':'mean','casual':'mean'})
temp_df.plot(title='租赁量随温度的变化')
plt.savefig('不同温度.png')
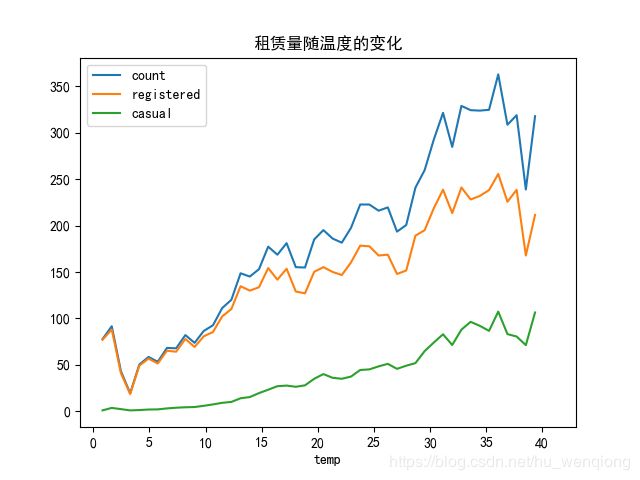
和月份还有季节的图结合起来看,他们达到了一致:气温太高和太低都会使租赁量降低,整体的趋势是随着气温的升高租赁量在上升,直到由于温度过高然后呈现下降趋势、
3、湿度对租赁量的影响
同样的方法,我们来分析湿度对于租赁量的影响。
#湿度
humidity_df=combined.groupby(['humidity']).agg({'count':'mean','registered':'mean','casual':'mean'})
humidity_df.plot(title='租赁量随湿度的变化')
plt.savefig('不同湿度.png')
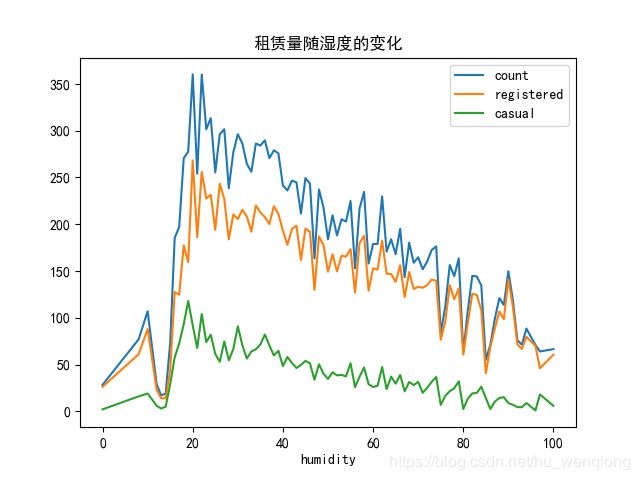
可以看到湿度在20左右的时候租赁量达到峰值,随后呈现下降趋势。
4、风速对租赁量的影响
windspeed_df=combined.groupby(['windspeed'],as_index=True).agg({'count':'mean','registered':'mean','casual':'mean'})
windspeed_df=windspeed_df.loc[windspeed_df['count'].isnull()==False]
windspeed_df.plot(title='租赁量随风速的变化')
plt.savefig('不同风速.png')
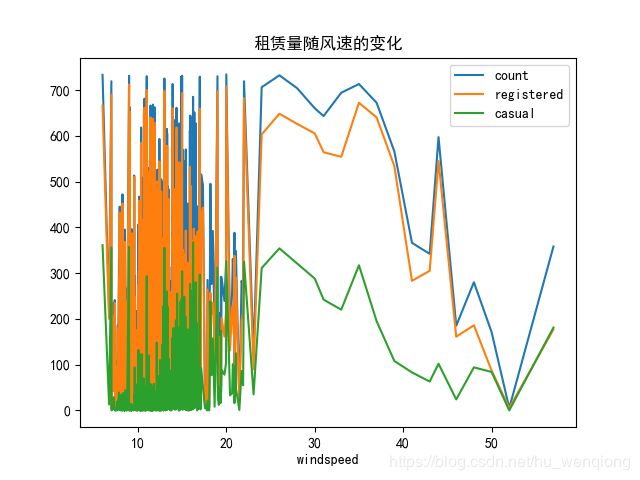
为什么会出现这种情况呢?主要是因为我们在进行填充的时候得到的数据过于密集,并且数据的波动很大,导致每组的数据个数都比较少。
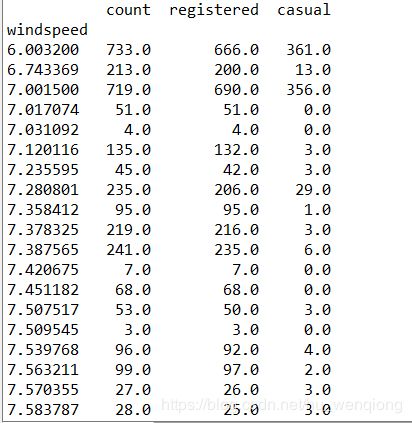
这是分组后的前几条结果,也能看到在风速变化很小的时候,均值可能会发生很大的变化。从后面的数据趋势来看,风速大于30的时候租赁量呈现下降趋势,但是在40过后有一处反弹,注册用户和总体的租赁量呈现相同的反弹,但是临时用户却没有,我们猜测这可能是注册会员的固定行程导致,也许是上下班高峰期的原因。将这条数据打印出来看一下。

时间为下午5点,符合我们的预期。
特征处理和选择
相关性分析
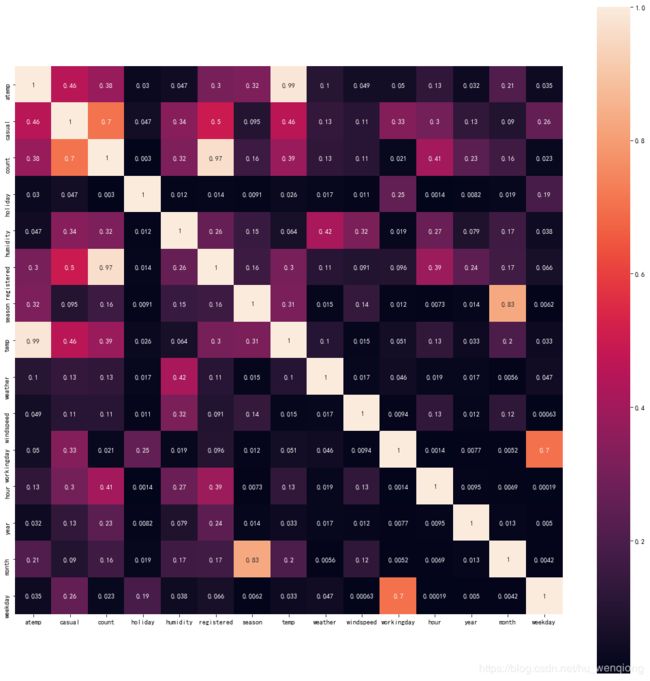
我们先来看一下各特征和租赁量的相关性分析
corr_df=combined.corr()
corr_df1=abs(corr_df)
fig=plt.gcf()
fig.set_size_inches(30,12)
sns.heatmap(data=corr_df1,square=True,annot=True,cbar=True)
plt.savefig('特征相关.png')
选择特征
通过各项分析后我们在这里将时段(hour)、温度(temp)、湿度(humidity)、年份(year)、月份(month)、季节(season)、天气等级(weather)、风速(windspeed)、星期几(weekday)、是否工作日(workingday)、是否假日(holiday),作为特征值。(当然这里的特征选择方法过于简单,如何在高维数据中选择合适的变量是一个非常重要的课题,有待进一步探索)。
里面的年份(year)、月份(month)、季节(season)、天气等级(weather)多类别型数据,我们使用one-hot转化成多个二分型类别。
combined_back=combined
dummies_month = pd.get_dummies(combined['month'], prefix='month')
dummies_year = pd.get_dummies(combined['year'], prefix='year')
dummies_season = pd.get_dummies(combined['season'], prefix='season')
dummies_weather = pd.get_dummies(combined['weather'], prefix='weather')
接下来就是划分训练集和测试集了
#分开训练集和测试集
combined.columns
train_df=combined.loc[combined['count'].isnull()==False]
test_df=combined.loc[combined['count'].isnull()==True]
datetime_col=test_df['datetime']
ylables=train_df['count']
log_y=np.log(ylables)
drop_columns=['casual','count','datetime','date','registered','atemp','month','season','weather','year']
train_df=train_df.drop(drop_columns,axis=1)
test_df=test_df.drop(drop_columns,axis=1)
构建和评估模型
1、建立训练子集和测试子集
这里我们并不把所有的训练集都用来训练模型,而是随机分成训练子集和测试子集,以便用来评估模型。同时,我们用log之后的count值进行模型的构建,因为原来的变量偏度比较大。
from sklearn.model_selection import train_test_split
from sklearn.metrics import accuracy_score
labels=log_y
x_train,x_test,y_train,y_test=train_test_split(train_df,labels,train_size=0.8)
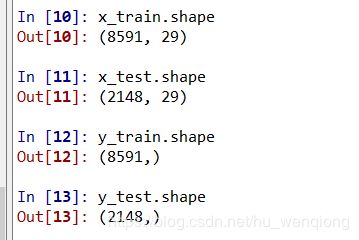
x_train.shape
x_test.shape
y_train.shape
y_test.shape
param_1={'n_estimators':list(range(300,1000,50))}
model_1=GridSearchCV(estimator = rf,param_grid = param_1, scoring='mean_squared_error',cv=5)
model_1.fit(x_train,y_train)
model_1.best_score_
model_1.best_params_
param_2={'max_depth':list(range(3,10,1)),'min_samples_split':list(range(10,20,2))}
model_2=GridSearchCV(estimator = RandomForestRegressor(random_state=10,n_estimators=900),param_grid = param_2, scoring='mean_squared_error',cv=5)
model_2.fit(windspeed_trainX,windspeed_trainY)
model_2.best_score_
model_2.best_params_
model_final=RandomForestRegressor(n_estimators=900,random_state=10,min_samples_split=10,max_depth=9)
model_final.fit(x_train,y_train)
predict_final=model_final.predict(x_test)
from sklearn.metrics import r2_score
r2_score(y_test,predict_final)
产生预测结果
test_pred=model_final.predict(test_df)
final_df=pd.DataFrame({'datetime':datetime_col,'count':np.exp(test_pred)})
final_df.to_csv('C:/Users/86186/Desktop/kaggle/共享单车/result-final.csv')
