《投资买房策略》项目分析报告
项目工作思路
整体项目的工作思路包括观察数据、清洗&转换数据、建立模型&预测这三大模块。
观察数据、清洗及转换数据是实施项目的大前提,主要包括以下操作:
- 观察属性特征
数据中除了房价之外的属性一共21项,包括具有地理位置属性的district、name、address、circle等,也有与房子建筑相关的building_type、floor_type、building_structure,还有小区内部相关的的property_fee、greening_rate、first_hand、plot_area等,还有与时间相关的date、age,部分也可以根据常识判断是否会对房价产生影响。
- 删除极端值和无用属性
房价price的数值特征如上显示,最小为2100元 ,最大为239887元,平均5.5万/平米,没有出现负值。再分析房价与房龄的散点图,发现一些偏离的极端值,删除掉;
floor_type、building_structure、tags属性的类型混乱,选择删除属性。
- 空缺值&数值变形处理
空缺值:
除了city 、name 、first_hand这三个属性,其它的属性都有数值缺失。
price数据的完整度为98.03%,date完整度为99.99%,空缺数据并不多,所以可以直接删掉空缺的数值;
age 、plot_area等的空缺值使用均值填充;
数值变形:
building_type需要合并类型,由原来的19种类型合并为5种类型,同时进行哑编码改造,将其每个属性值转化为一个二元属性维度,值对应为0或1;
有些属性的数据是偏态分布的,这种数据不均衡会影响算法准确性,所以需要对偏度较大数据做log变换;
date属性从字符型改为int型,值更改为距今的月数,以便做相关性分析;
为了实现在统一数据范围内的考量,需要对数据进行归一化处理;
- 建立模型和预测
问题分析与代码实现
经过以上数据预处理,综合回答以下的问题:
1、数据中其余信息是否与房价相关?相关性如何?
2、空余的信息是否可以通过房价进行预测补全?比如物业费
数据中除了房价之外的属性一共21项,包括具有地理位置属性的district、name、address、circle,与房子建筑相关的building_type、floor_type、building_structure,还有小区内部相关的的property_fee、greening_rate、first_hand、plot_area等,还有与时间相关的date、age,以上这些属性根据常识判断都与房价息息相关。
- 相关系数分析
数据进行前处理之后,将他们与price做correlation matrix 分析,选择正相关的属性,根据相关系数图表判断相关程度。
操作结果如下:
old number of features: 17
drop columns: [‘households’, ‘users’, ‘greening_rate’, ‘date’, ‘hot’, ‘building_type_BL’, ‘building_type_TL’, ‘building_type_others’, ‘first_hand_true’]
New number of features : 8
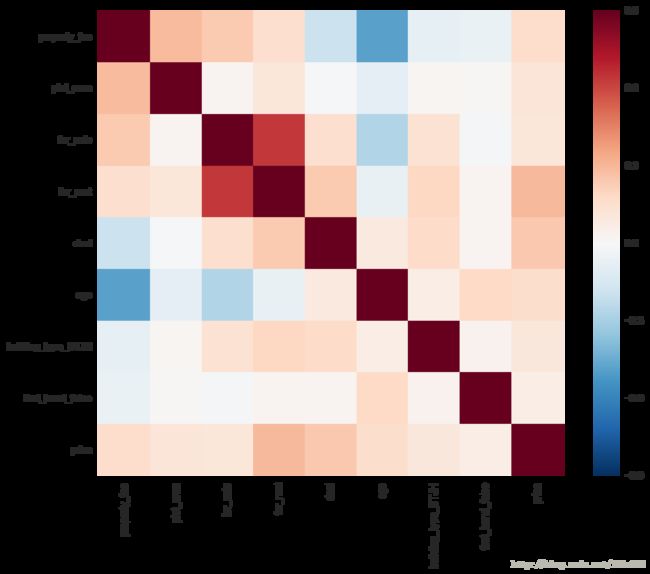
从相关性系数计算结果和作图分析:在原来17个属性中,删除了9个非正相关属性,包括’households’, ‘users’, ‘greening_rate’, ‘date’, ‘hot’, ‘building_type_BL’, ‘building_type_TL’, ‘building_type_others’, ‘first_hand_true’。经过选取的属性中,与price相关性较大的是for_rent、deal、age、property_fee、plot_area等属性。
经过预处理得到的相关系数结果看出来,property_fee、or_rent、deal、age、plot_area等这些属性都与房价有一定的相关性,适合用房价来补全。
- 房价和地理位置
数据中前几个属性district、name、address、circle,都含有地理位置信息,但是district 和 circle字段的内部分类不统一,既有区县(如:朝阳、海淀),也有商区(如:西单、新街口)和其它类型等,name(楼盘)虽然没有缺失值,但是楼盘名称并非唯一,不同的城市可能具有同样名称的楼盘,想要定位到真实的点位会有偏差。最终,选择具有唯一性的address属性,删除掉18.94%的空缺值,探讨地理位置与房价的关系。
想要探讨北京房价与地理位置的关系,我们先排除时间变化的影响,即探讨在同一时期的房源里,房价与地理位置的关系。将数据按照date分为11组,提取其中三组做对比分析,选择2016年1月1日、2016年8月1日和2017年6月1日这三个时间点数据的address和price属性,借助百度地图的api接口,在地图上呈现房价热力图如下(热力图参数设置为统一标准):
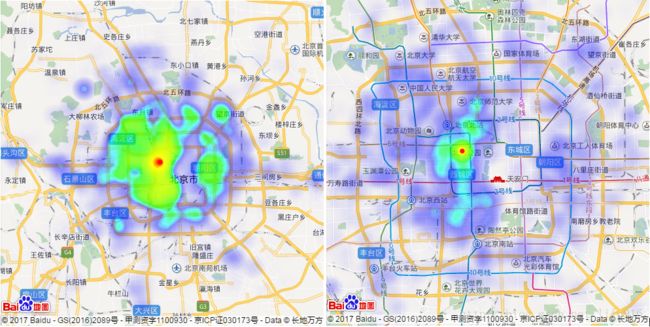
图1–2016年1月1日房价热力图(左图:北京全景,右图:北京五环内)

图1–2016年8月1日房价热力图(左图:北京全景,右图:北京五环内)
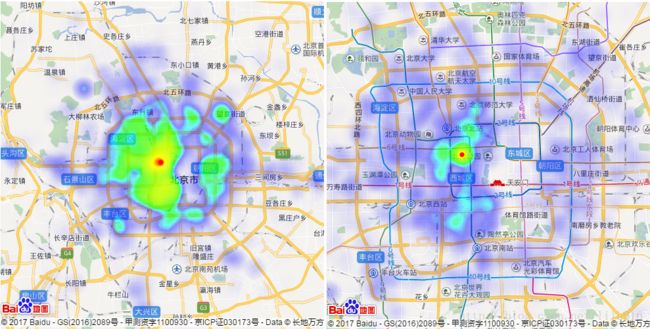
图3–2017年6月1日房价热力图(左图:北京全景,右图:北京五环内)
从以上房价热力图可以观察到:三个时间点下的房价空间变化特征相似,高房价主要集中在四环内。其中,以西城区、海淀区、朝阳区、东城区为代表,西城区的房价最高,以北海公园、西四和金融街附近的房价为代表,海淀学区整体房价较高,朝阳区东三环附近的国贸等CBD区域也是高房价热点。望京、国家体育场、北京南站附近房价也相对较高。
结合北京房价的空间特征来看,金融中心、旅游景区、学区房、火车站等所代表的经济、教育、交通等资源因素是影响北京房价最重要的因素。
- 代码部分
数据前处理:
import pandas as pd
import numpy as np
from sklearn.model_selection import cross_val_score, train_test_split
from sklearn.preprocessing import StandardScaler
from sklearn.linear_model import LinearRegression
from sklearn.metrics import mean_squared_error, make_scorer
from scipy.stats import norm, skew
import matplotlib.pyplot as plt
import seaborn as sns
from scipy.stats.stats import pearsonr

import math
def rmsle(y, y_pred):
    return  np.sqrt(mean_squared_error(y,y_pred))

%config InlineBackend.figure_format = 'retina' #set 'png' here when working on notebook
%matplotlib inline

pd.set_option('display.float_format', lambda x: '%.3f' % x)
data=pd.read_csv('D://fangjia.tsv',sep='\t')
#print (data)


#寻找并去除极端值
plt.scatter(data['age'],data['price'])
plt.xlabel("age")
plt.ylabel("price")
plt.show()

data = data[data.price<220000]
age_drop_index=data[data.age>100].index
data.drop(age_drop_index,axis=0, inplace=True)

data.price = np.log1p(data.price)

#data.describe()
#删除部分属性
data.drop(['city', 'district', 'name', 'address', 'circle', 'floor_type',
            'building_structure', 'tags'], axis=1, inplace=True)

#空缺数据
data=data[data['price'].notnull()]
data=data[data['date'].notnull()]
'users', 'greening_rate', 'date', 'hot',
data.loc[:, "age"] = data.loc[:, "age"].fillna(data['age'].mean())
data.loc[:, "plot_area"] = data.loc[:, "plot_area"].fillna(data['plot_area'].mean())
data.loc[:, "households"] = data.loc[:, "age"].fillna(data['households'].mean())
data.loc[:, "users"] = data.loc[:, "age"].fillna(data['users'].mean())
data.loc[:, "greening_rate"] = data.loc[:, "age"].fillna(data['greening_rate'].mean())
data.loc[:, "hot"] = data.loc[:, "age"].fillna(data['hot'].mean())
data.loc[:, "for_sale"] = data.loc[:, "age"].fillna(data['for_sale'].mean())
data.loc[:, "for_rent"] = data.loc[:, "age"].fillna(data['for_rent'].mean())
data.loc[:, "deal"] = data.loc[:, "age"].fillna(data['deal'].mean())


#数据变形
data = data.replace({"building_type": {'塔楼|板楼': "BTJH", '板楼|板塔结合': "BTJH", '塔楼|板楼|板塔结合': "BTJH", '塔楼|板塔结合': "BTJH",
                                      '联排|独栋': "others", "双拼|联排|独栋": "others", '联排|叠拼': "others", '双拼|独栋': "others",'板楼|砖楼':'砖楼',
                                       '双拼|联排|独栋|叠拼': "others", '联排|独栋|叠拼': "others", '双拼|联排|叠拼': "others",
                                      '双拼|叠拼': "others", '独栋|叠拼': "others",'板楼|砖楼':'ZL','双拼|联排': "others",'板楼':'BL','塔楼':'TL','板塔结合':'BTJH',}})

data.loc[:, "first_hand"] = data.loc[:, "first_hand"].astype('int')
data = data.replace({"first_hand": {0:'false',1:'true'}})
#data.building_type.value_counts()

#date处理
import datetime
starttime = datetime.datetime.now()
data.loc[:, 'date'] = pd.to_datetime(data['date'],format='%Y-%m')
from dateutil import rrule
import datetime
starts = data['date']
end = datetime.datetime.now()
l1=[]

for s in starts: #计算卖房时间距今的时间差
    months = rrule.rrule(rrule.MONTHLY, dtstart=s, until=end).count()
    l1.append(months)

data['date']=l1

#将数据划分为数值型与字符型
categorical_features = data.select_dtypes(include=["object"]).columns
numerical_features = data.select_dtypes(exclude=["object"]).columns
y = data[numerical_features].price
numerical_features = numerical_features.drop("price")
data_num = data[numerical_features]
data_cat = data[categorical_features]

#计算数值型属性偏度,选择偏度过大的属性做取对数处理
skewness = data_num.apply(lambda x: skew(x))
skewness = skewness[abs(skewness) > 0.5]
print(str(skewness.shape[0]) + " skewed numerical features to log transform")
skewed_features = skewness.index
data_num[skewed_features] = np.log1p(data_num[skewed_features])
#print(data_num[skewed_features])

#对字符型数据用哑编码的方式转换为定量特征
data_cat = pd.get_dummies(data_cat)


data = pd.concat([data_num, data_cat], axis=1)

print(data)
#数据标准化处理
stdSc = StandardScaler()
data.loc[:, numerical_features] = stdSc.fit_transform(data.loc[:, numerical_features])
#选择相关性较大的属性
corr = pd.concat([data,y],axis=1).corr()
drop_columns = list(corr['price'].loc[corr['price'] < 0,].index)
print('old number of features:',str(data.shape[1]))
print('drop columns:',drop_columns)
data.drop(drop_columns,axis=1, inplace=True)
print("New number of features : " + str(data.shape[1]))
#画出相关系数图
corr_new = pd.concat([data,y],axis=1).corr()
f,ax=plt.subplots(figsize=(12,9))
sns.heatmap(corr_new, vmax=0.9, square=True)

#X_train, X_test, y_train, y_test = train_test_split(data, y, test_size=0.3, random_state=0)
房价热力图:提取数据的address和price属性,借助百度地图的api接口,在百度地图上呈现房价热力图:
import json
from urllib.request import urlopen, quote
import requests,csv

#根据不同时间点生成某月的房价数据
l1=data['date'].value_counts().index.sort_values(ascending=True)

for i in l1:
    data=data[data['date']==i]
    data.to_csv('D://'+str(i)[:7]+'.csv',index=False,columns=['address','price'])


#定义获取经纬度数据的函数
def getlnglat(address):
    url = 'http://api.map.baidu.com/geocoder/v2/'
    output = 'json'
    ak = 'DD279b2a90afdf0ae7a3796787a0742e'
    add = quote(address) #为防止地址中的中文乱码
    uri = url + '?' + 'address=' + add  + '&output=' + output + '&ak=' + ak
    req = urlopen(uri)
    res = req.read().decode() #将其他编码的字符串解码成unicode
    temp = json.loads(res)
    return temp

#提取json文件中的经纬度数据
file = open('D:\\point1.json','w')
with open('D:\\2016-01.csv', 'r',encoding='gbk') as csvfile: #打开csv
    reader = csv.reader(csvfile)
    for line in reader:
        # 忽略第一行属性标签
        if reader.line_num == 1:
            continue
            # line是个list,取得所有需要的值
        b = line[0].strip()
        c = line[1].strip()
        lng_lat = getlnglat(b) #采用构造的函数来获取经度
        lng2=lng_lat.keys()
        if 'result' in lng2: #当是有错误数据时,就没有“result”属性,程序会跳出报错
            lng = lng_lat['result']['location']['lng']
            lat = lng_lat['result']['location']['lat']
        else:
            continue

        str_temp = '{"lat":' + str(lat) + ',"lng":' + str(lng) + ',"count":' + str(c) +'},'
        print(str_temp)#把数据copy到百度热力地图api的相应位置上
        file.write(str_temp) #写入文档
file.close() #保存
3、房价是否可以通过房龄、绿化率、物业费等进行预测?
- 代码部分
scorer = make_scorer(mean_squared_error, greater_is_better=False)
#定义交叉验证模式下的模型均方根误差函数
def rmse_cv(model, X, Y):
    rmse = np.sqrt(-cross_val_score(model, X, Y, scoring=scorer, cv=10))
    return (rmse)

#定义线性回归函数
def linear_regression():
    lr = LinearRegression()
    lr.fit(X_train, y_train)
    print("RMSE on Training set :", rmse_cv(lr, data, y).mean())
    y_train_pred = lr.predict(data)
    print('rmsle calculate by self:', rmsle(list(np.exp(y) - 1), list(np.exp(y_train_pred) - 1)))
    plt.scatter(y_train_pred, y_train_pred - y, c="blue", marker="s", label="Training data")
    plt.title("Linear regression")
    plt.xlabel("Predicted values")
    plt.ylabel("Residuals")
    plt.legend(loc="upper left")
    plt.hlines(y=0, xmin=10.5, xmax=13.5, color="red")
    plt.show()
    # Plot predictions
    plt.scatter(y_train_pred, y, c="blue", marker="s", label="Training data")
    plt.title("Linear regression")
    plt.xlabel("Predicted values")
    plt.ylabel("Real values")
    plt.legend(loc="upper left")
    plt.plot([10.5, 13.5], [10.5, 13.5], c="red")
    plt.show()
    return lr

linear_regression()
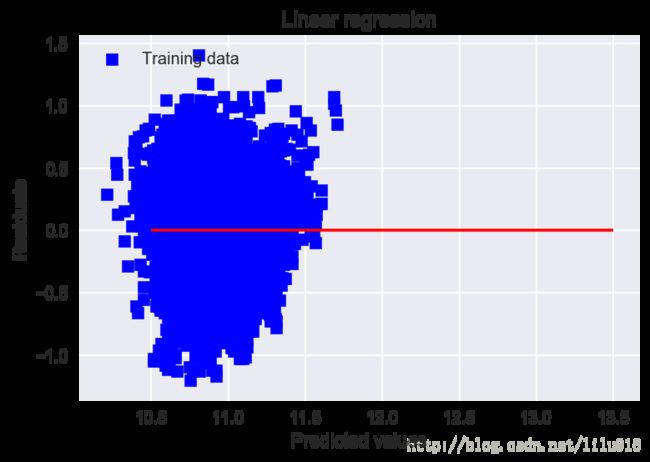
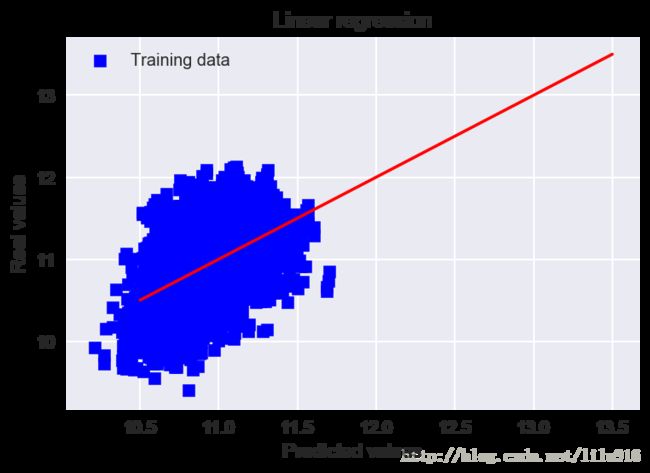
RMSE on Training set : 0.345447043724
rmsle calculate by self: 21945.3834665
分析:从均方根误差RMSE和预测值-真实值的散点图分布来看,根据提取的属性所建立的线性房价评估模型有一定程度的误差,用来预测房价不是非常的精准,还需要对比其它类型的模型来考量,有可能是作者的数据前处理的方法与属性选取还有待改进。

