#Python# 绘图相关
使用matplotlib的pyplot模块
import matplotlib.pylab as plt
# 绘制一条曲线
x = np.arange(0,1,0.1)
y = x ** 2
# r : 红色; - :实线
plt.plot(x,y,'r-',label = 'Curve')
# 坐标轴标识
plt.xlabel('x')
plt.ylabel('y')
# 坐标轴范围
plt.xlim([0,1])
plt.ylim([0,1])
# loc: 标识的位置, 使用best可根据曲线自动选择最合适的地方放置标识;
# loc可选参数有: ‘best’; ‘upper right’; 'upper left'; 'lower left'; 'lower right'; 'right'; 'center left'; 'center right'; 'lower center'; 'upper center'; 'center'
# fontsize: 标识字体大小
plt.legend(loc = 'best', fontsize = 10)
# 显示图片
plt.show()
# 在同一个图中绘制多条曲线
# 直接叠加就好了
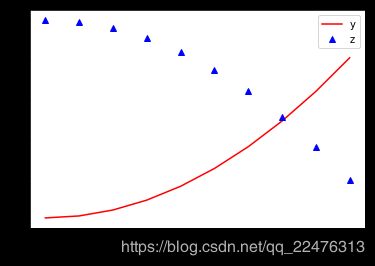
x = np.arange(0,1,0.1)
y = x ** 2
z = -x**2 + 1
plt.plot(x,y,'r-',label = 'y')
plt.plot(x,z,'b^',label = 'z')
plt.xlabel('x')
plt.legend()
plt.show()
# 将多个图按一定方式排列
# 使用subplot函数
# subplot(numRows,numCols,id)
# 即将整张区域划分为numRows*numCols块,numRows行,numCols列
# id表示第id个子图,排列顺序为从左到右,从上到下
# 举例:

# 各曲线的标识
L = ['curve 1','curve 2','curve 3','curve 4','curve 5','curve 6']
# marker样式; 's'是正方形
mrk = ['*','o','^','<','>','s']
# 曲线的颜色
# 'r': 红色; 'b': 蓝色,'m': 紫色?
# 'g': 绿色; 'y': 黄色,'k': 黑色
cl = ['r','b','m','g','y','k']
for i in range(2):
    for j in range(3):
        k = i*3 + j
        ax = plt.subplot(2,3,k + 1)
        ax.plot(x,x**k,marker = mrk[k], color = cl[k], label = L[k])
        # 坐标轴标识支持latex格式,nice
        plt.ylabel('$p^{(s)}_\infty$')
        plt.xlim([0,1])
        plt.legend(loc = 'lower right', fontsize = 10)
        plt.title(str((2,3,k+1)))
        # 调整子图的大小和子图间的间距
        # wspace: 子图左右间距
        # hspce : 子图上下间距
        plt.subplots_adjust(left= 1, bottom= 2, right= 3, top= 3,
                    wspace = 0.3, hspace=0.5)
plt.show()


