Python数据分析实战之二--某网站二手房信息(数据分析)
~~~接上一篇--数据处理~~~
在对数据进行处理后,需要对数据进行分析
1. 房型:
a. 首先对房型分别进行分析:
import numpy as np
import matplotlib.pyplot as plt
import seaborn as sns

%matplotlib inline

%pylab inline
pylab.rcParams['figure.figsize'] = (15, 10) # 调整图片大小

fig, axes = plt.subplots(nrows=2,ncols=2)
ax1, ax2, ax3, ax4 = axes.flatten()
for ax, col_name in zip(axes.flatten(), df_room.columns):
    temp = df_room[col_name].value_counts().reset_index().rename(columns = {"index":col_name+"-count"})
    sns.barplot(x=col_name+"-count",y=col_name,data=temp,ax=ax)
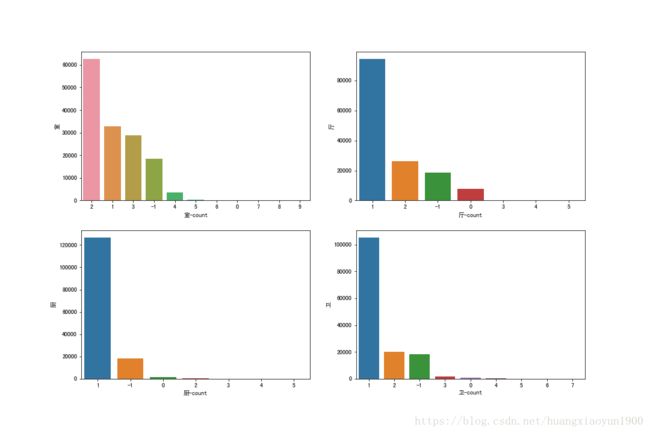
a. 由房型分组统计可知:
2室最多,其次分别为1室和3室,当房间数大于2室时,随着房间数的增加,二手房交易逐渐减少,包含有5个及以上房间的二手房交易非常少(<2000)。
1厅最多,其次分别为2厅和没有厅的房型,当厅数大于2厅时,随着厅数的增加,二手房交易逐渐减少,包含有3个及以上厅的二手房交易非常少(<2000)。
1厨最多,其次为没有厨房的房型,当厨房数大于1厨时,随着厨数的增加,二手房交易逐渐减少,没有厨房和有2个及以上厨房的二手房交易非常少(<2000)。
1卫最多,其次分别为2卫和3卫,当卫生间数大于3厨时,随着卫生间数的增加,二手房交易逐渐减少,没有卫生间和有3个及以上卫生间的二手房交易非常少(<2000)。
b. 除了分别对室、厅、厨、卫进行统计外,还可以通过groupby().count()对几室几厅进行分组统计:
# 对室和厅groupby分组计数
df_room2=df_room.groupby(['室','厅']).count().reset_index().drop(['卫'],axis=1).rename(columns={"厨":"计数"})

# 新增以来”n室n厅“,由室和厅组合而成,其中非str的值需加map(str)
df_room2["室厅"]=df_room2["室"].map(str)+"室"+df_room2["厅"].map(str)+"厅"

# 根据计数的值由高到低排序,取前10行数据
df_room3 = df_room2.sort_values(["计数"],ascending=False)[:10]

sns.barplot(x="室厅",y="计数",data=df_room3)
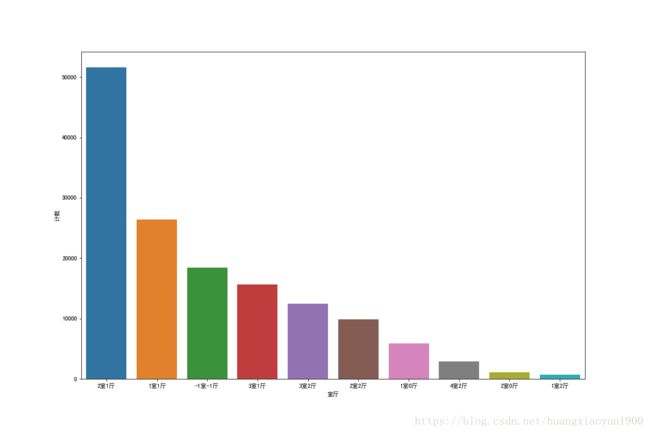
b. 由"室厅"分组后的数据统计可知:
2室1厅在二手房交易数量中占据绝对优势,其次是1室1厅和3室1厅。
c. 还可以通过交叉集pd.crosstab(x,y)来计数室和厅:
# 将数据集数据全部转换成int类型,df.astype(int)
df_room4 = df_room.astype(int)

# 将室和厅交叉计数,室为index,厅为columns
room_counts = pd.crosstab(df_room4['室'],df_room4['厅'])

# 由于其他行列计数较少,使用索引切片pd.iloc[],只保留计数较多的数据
room_counts = room_counts.iloc[2:6,1:4]

# Pandas API 绘图,pd.plot()
room_counts.plot(kind='bar')

# 保存图片
plt.savefig('交叉集室厅.png')
c. 由上图统计可知:
2室1厅、1室1厅和3室1厅分列二手房交易的前三;
3室以内的房型1厅仍是主流,4室的房型2厅占优势;
d. 此外,可以使用堆叠图统一比例组内对比:
# 将行规格化和为1,对比不同室下厅的比例
room_pcts = room_counts.div(room_counts.sum(1).astype(float),axis=0)

# 使用堆叠柱状图
room_pcts.plot(kind='bar',stacked=True)
plt.savefig('stacked room.png')
1个厅在3室及以下的房型中占主导;
2个厅的房型随着室数的增多而逐渐增多,在4室、5室中占据优势;
3个厅及以上房型从3室开始逐渐随着房间数增加而增多。
2. 价格与面积
a. 价格分布:
sns.distplot(df['价格'])由于存在一个单价非常高的价格,无法从图上看出什么,因此,需要使用df.cut()将连续值离散化,取存在数值的区间作图。
# 对连续特征离散化,更直观地看分布
cut_price = pd.cut(df['价格'],bins=100).value_counts()

# 取存在数值的区间
cut_price = cut_price[cut_price>0].reset_index()

# 作直方图
cut_price.plot.bar()

# plt.xticks(刻度位置,刻度标签,标签旋转角度)
plt.xticks(range(-1,28),cut_price['index'].values,rotation=60)
a. 由上图可知二手房成交量和价格的关系:
价格在181万元以下的二手房交易占绝对优势,随着价格逐渐增加,成交量逐渐下降。
b. 面积
df_area=df_area.astype(float)
area = df_area[df_area['面积']<=250]
sns.distplot(area, bins=50)
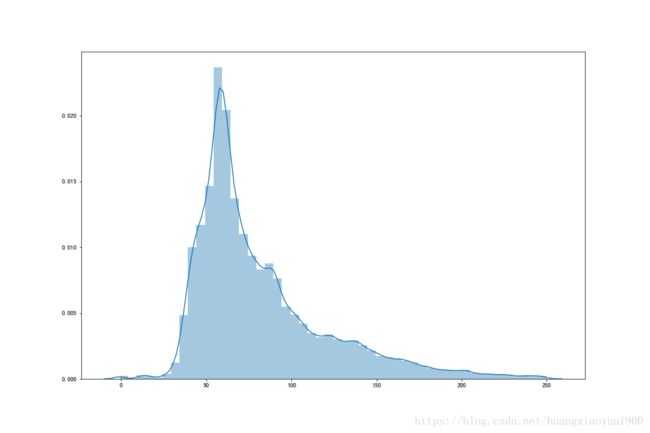
由上图可知,面积与成交量:
面积在60~65平米的房型成交量最多;
成交量主要集中在面积为50~75平米的房型中;
30平米以下和210平米以下的房型成交量较少。
c. 面积与价格关系:
sns.jointplot(x, y, data, kind='')
- jointplot是画两个变量或者单变量的图像,是对JointGrid类的实现
- x,y为DataFrame中的列名或者是两组数据,data指向dataframe ,kind是你想要画图的类型
- stat_func 用于计算统计量关系的函数
- kind 图形的类型scatter,reg,resid,kde,hex
也可以用matplotlib scatter画散点图
plt.scatter(x,y)
area_price = pd.DataFrame(list(zip(df['面积'].apply(lambda s: _parsenumber(s)).astype('float16').values, df['价格'].fillna(0).values)),columns=['area','price'])

area_price1 = area_price.loc[area_price['area']< 250]

sns.jointplot(x='area',y='price',data=area_price1)
由上图pearson相关系数0.26可知:价格和面积弱相关,因为价格除了与面积有关,还与地理位置、房型、建造时间等因素有关。
3. 房屋使用时间
diff_year = df_date['年'].astype('int16')-df['建造年代'].apply(lambda s: str(s).strip()).replace({'未知':-1}).fillna(-1).astype('float16')
diff_year1 = diff_year[(diff_year>=0)&(diff_year<70)]
plt.hist(diff_year1.values, bins=30)
由上图可知:
房屋使用时间在9~12年的二手房成交量最多;
交易的二手房使用年限主要集中在9~35年;
40年以上的老房子成交量明显减少。


